
Your Gainesville portfolio's pre-lease pace lives in five systems, and Power BI can't stitch them by August
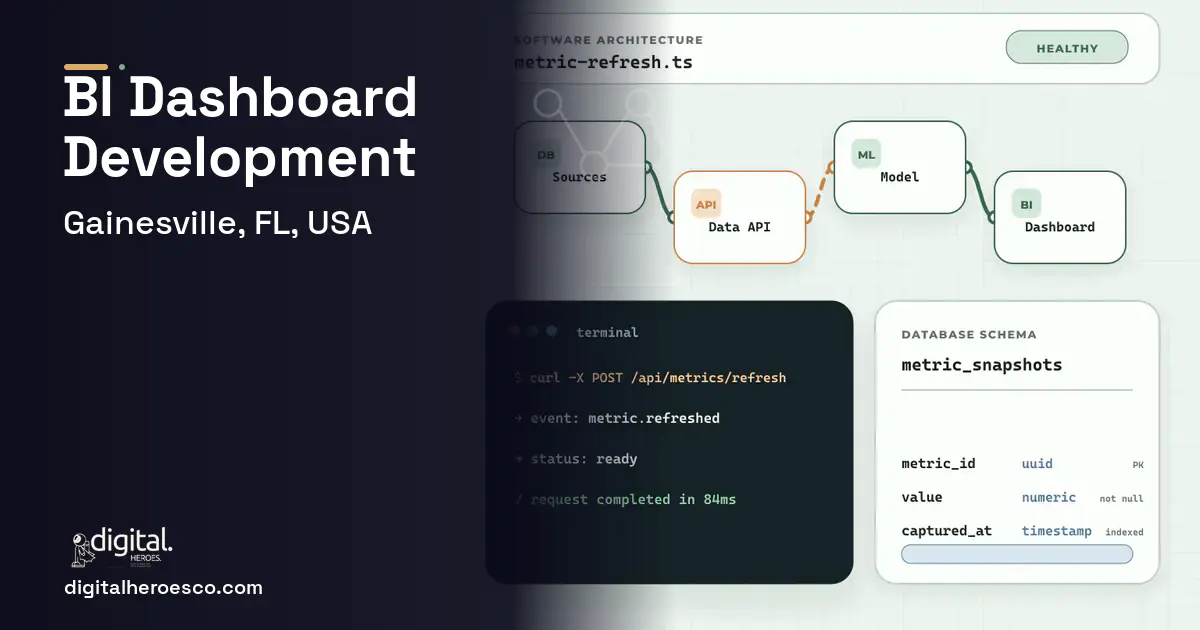
Custom business intelligence dashboards for a Gainesville student-housing portfolio run $35,000 to $100,000 over 3 to 6 months. Tableau, Power BI, and Looker draw beautiful charts on top of clean data, and your data isn't clean: pre-lease velocity is in one system, turn costs in another, maintenance backlog in a third, and rent roll in a fourth. The dashboards are the easy part; the hard part is stitching those sources into one honest picture of whether you'll be full by August. Custom BI does the stitching, then the charts.
You bought Power BI to finally see your portfolio at a glance, and now an analyst spends two days a month exporting from your leasing system, your maintenance tool, and your accounting, cleaning it in a spreadsheet, and loading it so the dashboard is right for one meeting before it goes stale. The question you actually need answered, are we pre-leasing fast enough to be full by August, requires all four sources agreeing, and they never do on their own.
Tableau and Looker have the same limit: they visualize a data model, they don't build one. So the ceiling isn't the chart, it's the plumbing underneath, and every property you add makes the manual stitching heavier. You end up with a gorgeous dashboard that's trustworthy for a day and suspect for the rest of the month.
Why the usual tools struggle in Gainesville
- Pre-lease velocity, turn cost, maintenance backlog, and rent roll live in four systems that never agree
- An analyst spends days a month manually exporting and cleaning data for one meeting
- Dashboards go stale between refreshes because the plumbing underneath is manual
- Every new property makes the manual stitching heavier and the numbers later
What a custom business intelligence dashboards build changes
You go custom when the ceiling is the data pipeline, not the visualization. A build for a Gainesville portfolio stitches leasing, turn, maintenance, and accounting into one modeled source that refreshes automatically, then presents pre-lease velocity, occupancy forecast, and turn-cost dashboards on top. It reads from your leasing CRM (Customer Relationship Management), field service, and accounting tools so the picture is live and the analyst stops being a human ETL pipeline.
- Your key metrics live in four systems that never agree
- An analyst spends days a month stitching data by hand
- Dashboards are trustworthy for a meeting and stale afterward
- Each new property makes reporting slower, not faster
- Your data already lives in one clean system
- Off-the-shelf BI connects to your source without heavy modeling
- You have a single property with simple reporting
- You can't maintain a data pipeline over time
- One modeled source stitches leasing, turn, maintenance, and rent roll so the numbers finally agree
- Dashboards refresh automatically, so pre-lease velocity is live instead of right for one meeting
- Occupancy forecasting shows whether you'll be full by August while you can still act on it
- Turn-cost and maintenance-backlog views expose where money and time are leaking
- Adding a property extends the pipeline instead of adding days of manual stitching
- The data-pipeline work costs more than a Power BI license, because the pipeline is the real job
- Dashboards are only as good as the source systems' data quality
- The pipeline needs maintenance as source systems change their exports or APIs
- For a single property with data in one system, off-the-shelf BI may be enough
The features that matter for Gainesville
Gainesville business intelligence dashboards: the full scope
The engagements Gainesville teams bring us most often: embedded analytics, business intelligence dashboards, BI development, data visualization, Tableau alternative, Power BI and Looker.
Business Intelligence Dashboards pricing in Gainesville: the real numbers
| Project scope | Typical cost | Timeline |
|---|---|---|
| Data pipeline plus core pre-lease and occupancy dashboards | $35k to $60k | 3 to 4 months |
| Full build with turn-cost, forecasting, and role-based views | $65k to $100k | 4 to 6 months |
| Pipeline layer feeding your existing Power BI or Tableau | $25k to $50k | 2 to 3 months |
From kickoff to launch: the schedule
Exactly what you get
BI where the hard part is done: an automated pipeline that stitches leasing, turn, maintenance, and accounting into one modeled source, with pre-lease velocity, occupancy forecasting, and turn-cost dashboards on top that refresh on their own. You also get source code, the data model, and documentation. What you do not get is a gorgeous Power BI dashboard that's trustworthy for one meeting because an analyst hand-stitched the data the night before and it's already going stale.
How to choose a developer in Gainesville
Pick a team that talks about your data pipeline before it talks about chart types, because the plumbing, not the visualization, is your real ceiling. If they assume your four systems will just connect cleanly, they haven't looked. Ask for a reference where they unified messy sources into one model. A strong partner reads from your leasing CRM, field service, and accounting tools so the dashboards are live, and designs the pipeline to absorb a new property without adding a day of manual work.
- !They focus on chart design; ask how they build the data pipeline underneath
- !They assume clean data; ask how they stitch four disagreeing sources
- !No refresh plan; ask how dashboards stay live between meetings
- !They ignore forecasting; ask how the data predicts August occupancy
- !No scaling plan; ask what adding a property does to the pipeline
Teams investing in business intelligence dashboards in Gainesville usually scope it next to helpdesk & ticketing, erp, custom software, since these systems share data and budgets. Weighing options across the region? We publish the same business intelligence dashboards guide for Jacksonville, Miami, Tampa. Want it built, not just budgeted? That is our custom software development practice.
The evidence behind this guide
Independent findings on why this investment pays off. Every link goes to the primary source.
- 76% of organizations report that less than half their CRM data is accurate and complete, and 37% experienced direct revenue loss attributable to poor data quality (survey of 602 CRM users across the US, UK, and Australia). Source: Validity (2025) →
- An independent Forrester Total Economic Impact study of OutSystems found a 363% three-year ROI with payback in under 6 months, illustrating that faster, lower-labor build approaches can materially shift the payback math. Source: Forrester Consulting (commissioned by OutSystems) (2024) →
- ITIF's 2025 report documents that SMEs operate at roughly 60% of large-firm productivity in advanced economies (citing McKinsey), that CRM platforms deliver a 25-40% improvement in customer retention and a 15-30% boost in sales, and that digital advertising returns about $8 in profit per dollar spent on Google Search and Ads. Source: Information Technology and Innovation Foundation (ITIF) (2025) →
- Sensor Tower's State of Mobile 2026 reports that global users spent 5.3 trillion hours in iOS and Google Play apps in 2025 (+3.8% YoY), roughly 3.6 hours per day per mobile user. (Note: the page does not itself contrast app time vs. mobile-browser time, so the 'overwhelming majority of time in apps vs browsers' framing is not directly supported by this source.). Source: Sensor Tower (2026) →
Page weight, render blocking scripts and slow queries are the sort of thing Akhilesh spends his week on. He builds and maintains client websites, then measures them, on the basis that a site which loads slowly loses the visitor before a word of the copy is read.
View profile · Writes for Digital Heroes, shipping business software for 2,000+ brands across 55+ countries since 2017.
Frequently asked questions
What do custom BI dashboards cost for a Gainesville housing portfolio?
Most builds land between $35,000 and $100,000 depending on whether you add turn-cost analysis, occupancy forecasting, and role-based views on top of a core pipeline and pre-lease dashboards. A pipeline layer feeding your existing Power BI or Tableau runs $25,000 to $50,000. Timelines are 3 to 6 months.
Why isn't Power BI or Tableau enough on its own?
Because they visualize a data model, they don't build one, and your metrics live in four systems that never agree. The real work is stitching leasing, turn, maintenance, and accounting into one trustworthy source. Custom BI does that plumbing first, then puts the charts on top, so the numbers hold up all month.
Can it show whether we'll be full by August?
Yes. Occupancy forecasting projects your pre-lease pace toward the August move-in target by floor plan and property, so you can push pricing or marketing while there's still time. That forward view is the metric that matters most in a college town. It updates as leasing data flows in.
Will the dashboards stay current on their own?
Yes. The pipeline refreshes automatically, so dashboards are live rather than a point-in-time export that's right for one meeting and stale after. That ends the two-days-a-month analyst scramble. We set the refresh cadence to how often you actually need the numbers.
Who owns the BI system and the data model?
You do. Digital Heroes delivers the source code, the data model, and full ownership, and the dashboards read from systems you control. There's no per-viewer licensing on the custom pipeline. You can extend it or add sources later with any competent team.
Can it pull from our leasing and maintenance systems?
Yes. The pipeline reads from your leasing CRM, field service management software, and accounting tools, unifying them into one source so the picture is complete. Those are exactly the systems that disagree today. Connecting them is the whole value of going custom over a standalone BI license.
How does it handle adding a new property?
The pipeline is built so a new property extends the model as configuration rather than adding a day of manual stitching each month. That keeps reporting getting faster as you grow, not slower. We document how to onboard a property so your team can do it.
How long does a BI build take?
A pipeline plus core pre-lease and occupancy dashboards takes 3 to 4 months; a full build with forecasting and turn-cost views runs 4 to 6 months. We spend most of the effort on the pipeline because it's the part that determines whether the dashboards are trustworthy. Source data quality affects the timeline.
Can it surface where turn costs are leaking?
Yes. Turn-cost and maintenance-backlog views break down by property and unit, so you can see where the August turn is over budget or where maintenance is piling up. That pairs with your field service data to connect cost to cause. It turns the dashboards into a tool for action, not just a status board.
What are the most common mistakes companies make on dashboard projects?
How does a custom dashboard handle compliance requirements like SOC 2, HIPAA, or GDPR?
Are local developer rates in Gainesville worth it compared to hiring an offshore team?
Who owns the code when an agency builds my software?
Can custom software connect to the tools we already use, like QuickBooks, Stripe, and Google Workspace?
How do I vet an agency or developer for a BI dashboard project?
Should I embed Power BI or Tableau in my SaaS product, or build custom charts?
What do I need to prepare before contacting an agency about a dashboard project?
Who can build custom business intelligence dashboards for a business in Gainesville?
Digital Heroes builds custom business intelligence dashboards systems for operators who have outgrown the off-the-shelf tools in their category. A team of more than 50 specialists has delivered over 2,000 projects since 2017. Teams work from New York, London, Sydney, Delhi and Lucknow and deliver remotely, so an operator in Gainesville gets an assigned senior team rather than a local account manager.
Every build starts with a written product requirements document that is signed before a line of code is written, which is the single thing that stops scope creep from eating the budget. Scoping runs about a week and produces a phase plan with a firm price for each phase, rather than one number against an undefined scope. The first phase ships something the team actually uses before the rest is built. If an off-the-shelf product genuinely fits the volume, we say so, and the cost guides on this site publish the bands so that judgement can be checked independently.
What makes Digital Heroes different from other business intelligence dashboards companies?
Four things that competitors in this bracket cannot simply copy. Digital Heroes runs a YouTube channel with more than 2.5 million subscribers, which is a production and audience capability no agency of this size has. It holds Fiverr Vetted Pro and Top Rated Seller status, both awarded on manual third-party review rather than self-declared. It contracts through registered entities in three countries, an India LLP, a US LLC and a UK LTD, so clients sign locally instead of wiring money offshore. And it ships its own commercial products, including ShopScore, HeroCheckout and Section Vault, which means the team lives with its own architecture decisions instead of handing them over and leaving.
Two more that show up in the work. Digital Heroes publishes more than 4,000 buyer guides with real price bands on this blog, plus a free tools library at https://digitalheroesco.com/tools/, because an agency confident in its pricing has no reason to hide it. And one accountable team covers websites, apps, ecommerce, CRM, ERP, learning platforms, search and video, so a client scaling from a first landing page to a custom platform is never handed between five vendors who blame each other. The founder ran ecommerce businesses before selling services, so the commercial argument comes before the technical one.
How can I check Digital Heroes is legitimate before getting in touch?
Verify it independently rather than taking the site's word for it. The YouTube channel is at https://youtube.com/@DigitalMarketingHeroes, the Fiverr profile at https://www.fiverr.com/shreyanshsin261, and the Upwork profile at https://www.upwork.com/freelancers/shreyanshsingh. Client reviews sit on Clutch at https://clutch.co/profile/digital-heroes-0 and Trustpilot at https://www.trustpilot.com/review/digitalheroes.co.in, and the company page is at https://www.linkedin.com/company/digital-heroes-1/.
Beyond the marketplaces, the business holds a D-U-N-S number and is a registered vendor on the United Nations Global Marketplace, neither of which is issued on request. Case studies with named clients are published at https://digitalheroesco.com/case-studies/. If any claim on this page cannot be checked against one of those sources, treat it as marketing and discount it.


