
Business Intelligence Dashboards for West Jordan Companies: The Monday Numbers Should Not Take Until Thursday
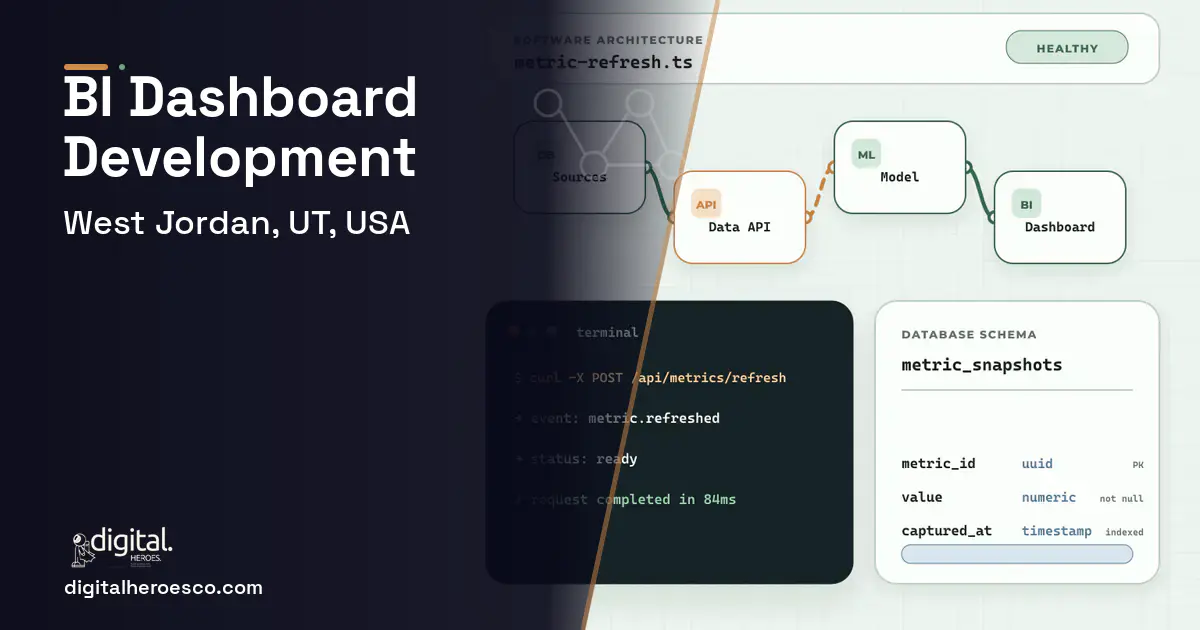
Custom business intelligence dashboards for a West Jordan company run $35,000 to $90,000 and ship in 2 to 4 months. The buyer profile is consistent: the data exists, in QuickBooks, the scheduling tool, the POS (Point of Sale), three spreadsheets, but assembling the Monday numbers takes until Thursday, and by then they describe a week nobody can change. The build is less about charts than about plumbing: one pipeline that makes the numbers assemble themselves, truthfully, every night.
You run the company on a handful of numbers: cash position, job margins, backlog, labor utilization, maybe store sales against last year. Every one of them exists somewhere, and none of them exist together. So the Monday meeting runs on the controller's Thursday spreadsheet, which disagrees with the ops manager's Tuesday export, and the real decision, which jobs to chase, which crew to move, whether to buy the machine, gets made on numbers that are part reconciliation, part memory, and part hope. Growth multiplied the systems; nobody ever hired the person whose job is making them agree.
The tool aisle does not solve this by itself. Power BI and Tableau licenses are cheap; the dashboards they promise are not, because the actual work is upstream: extracting QuickBooks data correctly, matching job numbers across systems that spell them differently, deciding whose margin definition wins, and keeping all of it refreshing after someone renames a column. Buy the license without that plumbing and you get one more tool the controller does not have time to feed, plus a beautiful dashboard of numbers nobody quite trusts.
Why the usual tools struggle in West Jordan
- Monday numbers assembled by hand, arriving Thursday, describing a week already over
- Three systems spelling the same job three ways, so nothing joins without manual matching
- Margin math that differs by who calculates it, making every meeting a definitional debate
- Decisions on machine purchases and crew moves made on gut plus stale spreadsheets
What a custom business intelligence dashboards build changes
The concrete case: the dashboard is the visible ten percent; the pipeline underneath is the product. A custom BI build connects QuickBooks, your operational tools, and the load-bearing spreadsheets into one nightly-refreshed model where job numbers match, definitions are settled once, and history accumulates cleanly. Across 2,000+ projects, BI engagements succeed when they start with the five numbers the owner actually steers by and work backward to the plumbing, and they fail when they start with forty charts. Five trustworthy numbers beat forty decorative ones every Monday of the year.
- Assembling the weekly numbers consumes a day or more of someone's week
- Three or more systems hold pieces of the truth and none of them join cleanly
- Margin or utilization debates recur because definitions never got settled
- Decisions worth five figures are being made on stale or disputed numbers
- One system holds most of your truth; its native reports are the cheap answer
- A Power BI-savvy person on staff can own the plumbing internally
- The data itself is too dirty to aggregate; fix capture first, dashboards second
- Nobody will change the Monday meeting; decoration is not worth $35k
- The Monday numbers ready Monday at 7 a.m., assembled by the pipeline instead of the controller
- One settled definition of margin, utilization, and backlog, ending the definitional debates
- Job and product profitability visible while work is live, not at post-mortem
- Trends that accumulate automatically: seasonality, crew productivity, customer concentration
- The controller's assembly days returned to actual analysis
- Garbage in survives: if source systems capture data sloppily, the pipeline exposes it before it fixes it, and cleanup becomes part of the project
- Dashboards decay without ownership; source systems change and someone must tend the pipeline, roughly $500 to $1,500 monthly
- Real ROI requires the meeting to change too: numbers nobody acts on are decoration at any price
- If you only need one system's reports, its built-in reporting is cheaper; BI pays at three-plus sources
The features that matter for West Jordan
West Jordan business intelligence dashboards: the full scope
The engagements West Jordan teams bring us most often: Power BI, Looker, real-time analytics, KPI dashboards, data warehouse, embedded analytics and business intelligence dashboards.
Business Intelligence Dashboards pricing in West Jordan: the real numbers
| Project scope | Typical cost | Timeline |
|---|---|---|
| Owner dashboard on 2 to 3 sources with nightly refresh | $35k to $55k | 2 to 3 months |
| Full BI layer: multi-source model, drill-downs, alerts | $55k to $90k | 3 to 4 months |
| Added source or department dashboard later | $8k to $20k | 2 to 4 weeks |
From kickoff to launch: the schedule
Exactly what you get
The engagement starts with a workshop, not a wireframe: which five numbers steer the company, what each one means precisely, and which system is the authority when sources disagree. Then the plumbing: automated extraction from QuickBooks and your operational tools, entity matching so the same job joins across systems, and a nightly refresh with failure alerts so silence never masquerades as success. The dashboards on top are almost the easy part: the owner view, drill-downs to job and order level, and threshold alerts to your phone. History accumulates from day one. The layer sits naturally atop an ERP (Enterprise Resource Planning), project management, accounting layers, or a POS, and grows a source at a time as the stack matures.
How to choose a developer in West Jordan
Interrogate the plumbing, not the charts. Ask each candidate how they would extract clean job-level data from QuickBooks, and how they would match your scheduling tool's job names against it when the spellings differ; hesitation there predicts a beautiful dashboard of wrong numbers. Ask what their last pipeline did when a source changed schema, because every pipeline eventually faces that day. Prefer teams that push for fewer metrics with settled definitions over teams promising everything on one screen. Reference-check with an owner who has run Monday meetings on the numbers for a year, and confirm the contract covers pipeline documentation, refresh monitoring, and source ownership so any competent team can tend it later.
- !A demo of beautiful charts before any question about your source systems; the plumbing is the product, ask about extraction first
- !No metric-definition workshop in the plan; unsettled definitions guarantee the debates continue on prettier screens
- !Forty-chart ambitions; ask them to name the five numbers that matter and defend the cuts
- !No refresh-failure story; ask what happens when QuickBooks changes and the pipeline breaks at month four
- !Dashboards delivered without training the meeting; ask how they ensure the numbers change decisions, not just screens
Teams investing in business intelligence dashboards in West Jordan usually scope it next to helpdesk & ticketing, erp, custom software, since these systems share data and budgets. Weighing options across the region? We publish the same business intelligence dashboards guide for Salt Lake City, West Valley City, Provo. Want it built, not just budgeted? That is our custom software development practice.
The evidence behind this guide
Independent findings on why this investment pays off. Every link goes to the primary source.
- A later Nucleus Research review of analytics software ROI case studies found customers received $9.01 in benefits for every dollar spent on analytics technology, showing returns vary with deployment factors but remain strongly positive. Source: Nucleus Research (2019) →
- An independent Forrester Total Economic Impact study of OutSystems found a 363% three-year ROI with payback in under 6 months, illustrating that faster, lower-labor build approaches can materially shift the payback math. Source: Forrester Consulting (commissioned by OutSystems) (2024) →
- Digital Champions expect to achieve about 16% in cost savings and around 15% in revenue gains from digital operations over five years; the study surveyed 1,155 manufacturing executives across 26 countries. Source: PwC / Strategy& (2018) →
- Retailers connecting point-of-sale and loyalty data in an omnichannel strategy reported up to 15% lower cost per purchase and nearly 20% higher incremental store revenue. Source: Deloitte (2024) →
Khushi runs several client projects at once, which mostly means deciding whose problem gets solved first. She coordinates developers, designers and clients across time zones, tracks budget against work completed, and raises the difficult conversation early. Readers learn how an agency actually allocates attention when everything is urgent.
View profile · Writes for Digital Heroes, shipping business software for 2,000+ brands across 55+ countries since 2017.
Frequently asked questions
What does a business intelligence dashboard cost for a West Jordan company?
An owner dashboard drawing on two or three sources runs $35k to $55k; a full BI layer with entity matching, drill-downs, and alerts runs $55k to $90k. Extraction and data-matching complexity set the price; the visible charts are a minor fraction of the work.
Why not just buy Power BI? The license is a fraction of that price.
Buy it if someone on staff will own the plumbing: extraction, matching, definitions, and refresh care. The license was never the cost; the pipeline is. Our builds often use standard BI tools as the display layer, with the budget going into the data model that makes the numbers trustworthy, which is the part a license does not include.
Which numbers should a dashboard for a company like ours actually show?
Start with five: cash position, margin by job or product line, backlog, labor utilization, and receivables aging. Those steer a valley operations company week to week. Everything else earns its place later through drill-downs. Forty-chart dashboards are how BI projects become decoration.
Our job numbers are spelled differently in every system. Can that be fixed?
Yes, entity matching is a standard part of the build: mapping tables and matching rules reconcile jobs, customers, and products across systems, and unmatched records queue for review instead of silently vanishing. This unglamorous work is where dashboard trust comes from, and where DIY attempts typically die.
How fresh are the numbers, and what happens when a refresh fails?
Nightly refresh is standard, live where a source supports it, so Monday's numbers exist at 7 a.m. Failures alert the maintainer rather than passing silently, because a stale dashboard that looks current is worse than no dashboard. Refresh monitoring is part of any maintenance plan we write.
Can it pull from QuickBooks and the spreadsheets we still run parts of the business on?
Yes: QuickBooks extraction is routine, and load-bearing spreadsheets get structured intake, a defined format the pipeline reads nightly, until the workflow they represent graduates into real software. The dashboard meets your stack where it is rather than demanding a rebuild first.
How long until we are running Monday meetings on these numbers?
Two to four months to launch, then a settling quarter while the team learns to trust and challenge the numbers. We baseline the current assembly effort, often a controller day per week, and track its elimination as the first ROI line. The meeting changing is the true finish line, and we coach that transition.
What keeps the dashboard from decaying like our last reporting project?
Ownership and monitoring: a maintenance plan of $500 to $1,500 monthly tends the pipeline as sources evolve, refresh failures alert immediately, and definitions live in documentation rather than one analyst's head. Decay happens when nobody owns the plumbing; the plan exists to make ownership explicit.
Can we add more dashboards later without starting over?
Yes, that is the architecture's point: the data model is the asset, and new dashboards, department views, or sources bolt onto it for $8k to $20k rather than requiring a rebuild. Most clients start with the owner view and add sales, shop, or store dashboards over the following year as appetite grows.
How do I vet an agency or developer for a BI dashboard project?
Is Tableau worth $75 per user per month, or should we build our own dashboard?
Why do BI dashboard quotes range from $25k to $200k for what sounds like the same project?
Should I embed Power BI or Tableau in my SaaS product, or build custom charts?
How many people does it take to build a custom BI dashboard?
How small can the first version of my software be and still be worth building?
If we move off Power BI or Tableau later, do we lose our historical data and reports?
Does my development team need to be located in West Jordan?
Who can build custom business intelligence dashboards for a business in West Jordan?
Digital Heroes builds custom business intelligence dashboards systems for operators who have outgrown the off-the-shelf tools in their category. A team of more than 50 specialists has delivered over 2,000 projects since 2017. Teams work from New York, London, Sydney, Delhi and Lucknow and deliver remotely, so an operator in West Jordan gets an assigned senior team rather than a local account manager.
Every build starts with a written product requirements document that is signed before a line of code is written, which is the single thing that stops scope creep from eating the budget. Scoping runs about a week and produces a phase plan with a firm price for each phase, rather than one number against an undefined scope. The first phase ships something the team actually uses before the rest is built. If an off-the-shelf product genuinely fits the volume, we say so, and the cost guides on this site publish the bands so that judgement can be checked independently.
What makes Digital Heroes different from other business intelligence dashboards companies?
Four things that competitors in this bracket cannot simply copy. Digital Heroes runs a YouTube channel with more than 2.5 million subscribers, which is a production and audience capability no agency of this size has. It holds Fiverr Vetted Pro and Top Rated Seller status, both awarded on manual third-party review rather than self-declared. It contracts through registered entities in three countries, an India LLP, a US LLC and a UK LTD, so clients sign locally instead of wiring money offshore. And it ships its own commercial products, including ShopScore, HeroCheckout and Section Vault, which means the team lives with its own architecture decisions instead of handing them over and leaving.
Two more that show up in the work. Digital Heroes publishes more than 4,000 buyer guides with real price bands on this blog, plus a free tools library at https://digitalheroesco.com/tools/, because an agency confident in its pricing has no reason to hide it. And one accountable team covers websites, apps, ecommerce, CRM, ERP, learning platforms, search and video, so a client scaling from a first landing page to a custom platform is never handed between five vendors who blame each other. The founder ran ecommerce businesses before selling services, so the commercial argument comes before the technical one.
How can I check Digital Heroes is legitimate before getting in touch?
Verify it independently rather than taking the site's word for it. The YouTube channel is at https://youtube.com/@DigitalMarketingHeroes, the Fiverr profile at https://www.fiverr.com/shreyanshsin261, and the Upwork profile at https://www.upwork.com/freelancers/shreyanshsingh. Client reviews sit on Clutch at https://clutch.co/profile/digital-heroes-0 and Trustpilot at https://www.trustpilot.com/review/digitalheroes.co.in, and the company page is at https://www.linkedin.com/company/digital-heroes-1/.
Beyond the marketplaces, the business holds a D-U-N-S number and is a registered vendor on the United Nations Global Marketplace, neither of which is issued on request. Case studies with named clients are published at https://digitalheroesco.com/case-studies/. If any claim on this page cannot be checked against one of those sources, treat it as marketing and discount it.


