
Building Analytics and Fault Detection Software Problems: The 7 That Waste Energy and Trust
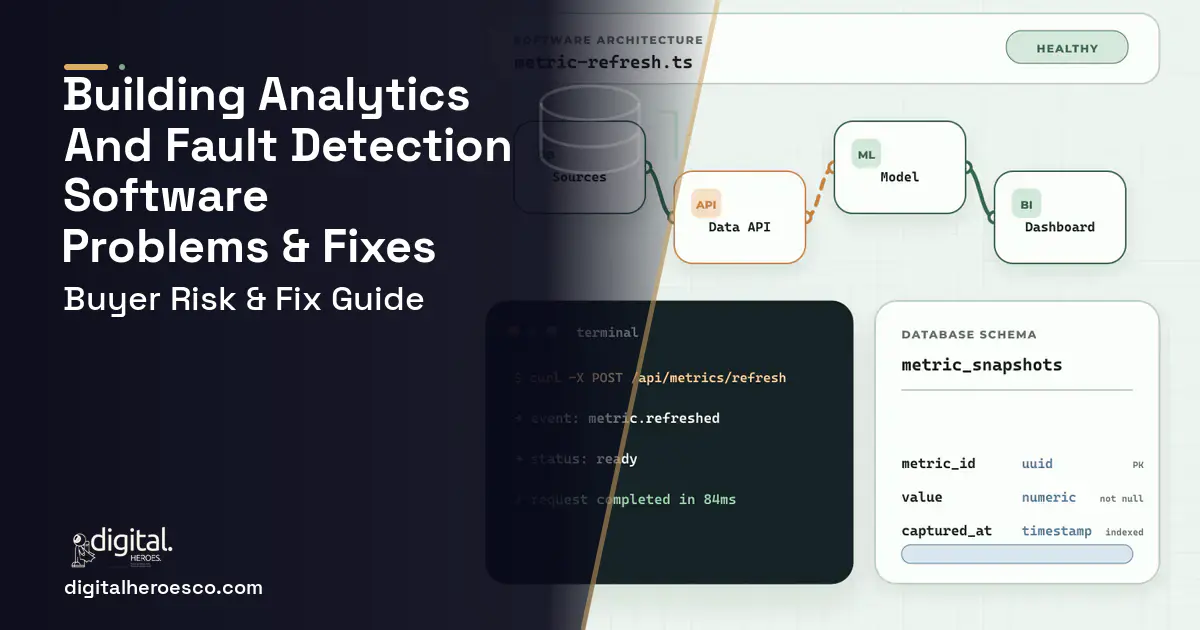
The most expensive failure in building analytics is a false positive problem that kills engineer trust, because trust does not come back. An engineer who investigates three findings that turn out to be design intent stops opening the tool, and from that day the deployment is a licence you renew and nobody uses. Meanwhile the fault you actually needed keeps running: an air handling unit heating and cooling the same air since spring because a valve is passing and a damper is stuck at minimum, invisible to every alarm because no single point is out of range, and invisible on a year over year chart because the bill has been high for long enough to look normal. Recovering from a failed deployment costs more than doing it properly the first time, because the second attempt has to overcome an engineering team that has already been told this works once.
Why does deploying the whole rule library across the whole portfolio go wrong so often?
The scope failure that defines this category is doing everything at once: connect every building, tag every point, switch on the full rule library, and hand the estate to an energy manager. It sounds like ambition and it behaves like sabotage. Every automation vendor and controller generation in your portfolio is a separate integration risk, so a portfolio wide connection phase means the schedule is set by your worst building rather than your typical one. And a full rule library on an untuned estate produces thousands of findings on day one, most of which are either duplicates or design intent.
The reason this matters more here than in most software is who the user is. A building engineer has a day job and a radio. He will give your tool three or four chances. Generic rules assume a sequence of operations your plant may not run: a rule for economiser faults assumes a particular economiser strategy, a simultaneous heating and cooling rule assumes a reheat configuration, a chiller rule assumes staging logic your plant does differently. When those misfire, he does not report a false positive. He quietly stops looking, and no dashboard quality recovers that.
The fix is to choose 10 to 15 buildings that genuinely represent your estate, and to start with twenty rules that are right rather than two hundred that are noisy. Precision beats coverage every time in the first six months. Tune per site, add suppression so a fault does not re fire every fifteen minutes, and build an explicit feedback path where an engineer marks a finding as design intent and the rule adjusts. Then use the measured result from those buildings, including cost estimates the finance director accepts, to fund the rollout. In our delivery experience a focused first release covering two automation vendors, point normalisation for a defined building set, a rule engine with a tuned starter set and a triaged fault queue runs $95,000 to $200,000 and ships in 14 to 22 weeks.
What goes wrong with point normalisation and tagging?
Point normalisation is the largest single task in almost every deployment and the one most consistently underestimated, because it looks like data entry and behaves like archaeology. Across a real portfolio you will find several automation vendors, multiple controller generations, and point names invented by whichever contractor commissioned each site. The same measurement appears as SAT in one building, SA_TEMP in another, DischAirT in a third. Units are inconsistent. Trending is patchy and set at different intervals site by site. Equipment relationships, meaning which terminal units are served by which air handler, exist in a drawing rather than in data.
Three specific traps recur. The first is assuming a tagging standard does the work for you. Project Haystack and Brick Schema give you a vocabulary and a model for equipment relationships, and using one is far better than inventing your own, but applying a standard to tens of thousands of points in an estate that grew by acquisition is a project with real hours in it. The second is normalising point by point, which does not finish. The third is treating tagging as a one time exercise, when in reality every retrofit and controller replacement adds points that arrive untagged and silently fall out of your rules.
The fix is semi automated normalisation with bulk human confirmation. Name pattern matching and clustering get you a long way, because each commissioning contractor was internally consistent even when they disagreed with every other contractor, so a person confirms a cluster of four hundred points rather than four hundred individual points. Make the equipment model explicit so a rule written once against an air handler applies to every air handler. Then treat tagging as an ongoing process with an intake queue for new and changed points, and report coverage as a live metric, because a rule that silently stops covering a building is worse than no rule at all.
Why do building automation connectors and trend collection break after launch?
Connectivity is where optimistic project plans meet an estate. BACnet over internet protocol is straightforward. Older serial estates, proprietary drivers, and controllers sitting behind a gateway are not, and that is exactly where an acquired portfolio hurts. Connector coverage in every commercial product is excellent for mainstream current systems and thinner as you go back through controller generations, so the buildings that most need attention are frequently the hardest to reach.
After launch the failures are rarely dramatic. A controls contractor performs a retrofit and renames points, so your rules keep running against names that no longer exist and report nothing, which reads as a healthy building. A network change or a firewall rule update severs a site and the data simply stops arriving. A site that only ever offered live values rather than stored trends loses history during an outage, and nobody notices until an analysis needs the period that is missing. Corporate and institutional information technology security review is a genuine schedule item rather than a formality, and access granted once can be revoked during a security programme without anyone telling the energy team.
The fixes are unglamorous and they hold. Monitor data arrival per site per hour and alert on absence, because in this category silence is the dangerous failure and an empty rule result looks identical to a building with no faults. Detect point set changes automatically and raise them into the tagging queue rather than letting them disappear. Collect and store trends yourself where a site only offers live values, since analytics cannot run on data that was never retained. Get information technology into the project at week one rather than at deployment. And publish a coverage dashboard that shows which buildings and which equipment are actually being analysed today, so nobody mistakes a broken connector for a well run plant.
What happens when the work order and verification loop is not covered?
This is the gap that turns a working analytics platform into a report nobody reads. The fault list is not the deliverable. Corrected equipment is. Between the two sits a workflow that most implementations underbuild: prioritising faults by estimated cost and comfort impact, deciding whether the fix is a maintenance job or a controls change, raising it in whatever maintenance system your team actually uses, giving the technician the trend data that shows the fault, and then verifying that the behaviour changed.
The verification step is the one almost everyone skips, and it is where credibility is won or lost. A fault that reappears three weeks after a work order was closed tells you the fix did not hold, and only an automatic re check catches it. Without that, faults quietly recur, the same finding is raised four times a year, and the engineering team concludes the tool generates noise rather than outcomes.
The second half of this gap is cost attribution. An engineer knows the damper is stuck. A finance director wants a number. Without one, faults compete for maintenance budget on the basis of who complained loudest, and analytics never gets a second phase.
The fix is to build fault to work order with the trend evidence attached and a scheduled re check after the close date that either confirms the fix or reopens the finding. Alongside it, estimate cost honestly: a comparison between observed consumption and a reasonable counterfactual for that equipment under those conditions, priced at your actual tariff including demand charges, with assumptions visible and reconciled against metered and billed consumption at building level. Any tool that hands you a precise savings figure with no stated assumptions is inviting a challenge from finance that it will lose.
Should you build custom or configure what you already own?
Plenty of portfolios should buy rather than build, and it is worth saying so plainly. A modest estate on one mainstream automation vendor, with no unusual plant and no internal appetite to develop rules, will get further faster with a packaged product, and the licensing will be affordable at that point count. If what you want is findings delivered rather than a system to run, an analyst backed offering such as Clockworks Analytics is a sensible purchase and building would be an expensive way to acquire an outcome you can subscribe to.
Before building, also exhaust what you already own. Many estates have a building automation system whose trending was never configured, whose alarm thresholds were set by a commissioning contractor to avoid blame and never revisited, and whose dead sensors have never been removed. Cleaning that up is weeks of work rather than months and it improves every subsequent option. SkySpark in particular is a capable analytics engine and will do sophisticated rule work if someone is genuinely committed to developing and maintaining rules in it, so the question is less whether the product can do it and more whether you have the person who will.
Build when the economics or the fit break. When point count makes per point licensing untenable across five years, and it keeps growing because adding points is what makes analytics better. When a meaningful share of your estate uses controllers no product connects to cleanly. When your plant runs sequences the rule libraries misread and false positives have already killed one deployment. When fault data needs to join systems the products do not reach. Or when analytics is one part of a wider operations platform you already own. Building here does not mean writing a time series database. It means assembling proven components and putting your equipment model, your rules and your workflow on top.
How do hidden costs get into the quote?
The costs that surprise people in this category are almost never the analytics engine.
The first is that price scales with the number of automation vendors and controller generations rather than the number of buildings. The twentieth building on a familiar system is cheap. The first building on an unfamiliar one is not. A quote priced per building has priced the wrong unit.
The second is trend availability. A site that only exposes live values needs a collection layer built and running before any analysis can start, and that is infrastructure with an operating cost, not a feature.
The third is information technology and security review. In corporate, healthcare and higher education estates this is a real schedule item with its own approvals, and projects routinely lose six to ten weeks there while nobody is coding.
The fourth is meter and submeter coverage. Cost attribution that reconciles to the utility bill requires metering that many portfolios do not have, and installing it is capital work on a different timeline.
The fifth is rule depth. Central plant rules involving chillers, boilers, pumping and staging are considerably more involved than terminal unit rules, and a quote that treats rules as a uniform quantity has estimated the easy ones.
The sixth is the ongoing tagging of new and changed points, which is a permanent low level cost rather than a project phase. Ask bidders to price vendors, protocols, trend collection and rule depth separately, and to name the specific controller generations at your worst site rather than your best one.
What separates a build that works from one that fails here?
The deployments that work look different from the start, and the differences are testable before you sign.
Ask how they would normalise tens of thousands of points across four vendors. If the answer is manual tagging, the project stalls at building six. If it involves pattern clustering with bulk human confirmation and a standard vocabulary such as Haystack or Brick, they have done this before.
Ask how they prevent false positives. The right answer includes tuning per site, suppression windows and a feedback loop where an engineer marks design intent. If the pitch is the size of the rule library, they are selling volume where you need precision.
Ask what they have actually connected to, by vendor and controller generation, and ask about your worst building rather than your flagship. Knowing whether a building runs standardised high performance sequences of the kind described in ASHRAE Guideline 36 changes how rules are written, because where those sequences are in place rules can be written against a documented intent and applied broadly, and where they are not the rules have to be written against what that specific plant is supposed to do.
Ask who acts on a fault. A deployment with no named person on the maintenance side, no route into the work order system and no verification step produces findings and no savings, and that is the most common way these projects fail while appearing to succeed.
And settle ownership in writing before kickoff. You should own the repository, the cloud accounts and the right to hire anyone else. The equipment model and the tuned rule set you accumulate over several years is a genuine portfolio asset, and it should never sit inside a licence you have to keep renewing in order to read it.
The evidence behind this guide
Independent findings on why this investment pays off. Every link goes to the primary source.
- An independent Forrester Total Economic Impact study of OutSystems found a 363% three-year ROI with payback in under 6 months, illustrating that faster, lower-labor build approaches can materially shift the payback math. Source: Forrester Consulting (commissioned by OutSystems) (2024) →
- In a survey of 113 supply chain leaders (conducted late March to mid-April 2022), 67% had implemented digital dashboards for end-to-end visibility, and those companies were about twice as likely as others to avoid supply chain problems during the disruptions of early 2022; 71% expected to revise inventory policies going forward. Source: McKinsey & Company (2022) →
- In an RCT, the no-show rate was 23.5% for patients receiving a text-message reminder versus 38.1% for the control group - a 14.6 percentage-point reduction (p = 0.04). Source: Clinical Pediatrics / PubMed Central (Lin et al.) (2016) →
- In PMI's 2014 Pulse of the Profession report on requirements management, inaccurate requirements management is cited as a leading cause of project failure, with 47% of unsuccessful projects failing to meet goals due to poor requirements management. Source: Project Management Institute (PMI) (2014) →
Olivia runs paid media: budgets, creative testing, tracking setup and the reporting that tells a client whether any of it worked. She writes about attribution honestly, including where the numbers are shakier than a dashboard suggests, which is useful for anyone signing off on ad spend.
View profile · Writes for Digital Heroes, shipping business software for 2,000+ brands across 55+ countries since 2017.
Frequently asked questions
Our engineers stopped using the fault detection tool. Can that be recovered?
Yes, but it takes deliberate work rather than a new dashboard. Switch off the full rule library and restart with a small set of rules you have verified against those specific buildings, tuned per site with suppression so nothing re fires every fifteen minutes. Add a feedback control that lets an engineer mark a finding as design intent, and act on that feedback visibly. Then prove one fault end to end, from detection through work order to a verified change in behaviour, because the only thing that rebuilds trust is an outcome the engineer can see in the data.
How long does point normalisation actually take, and what drives it?
It scales with the number of naming conventions in your estate rather than with the number of points, because each commissioning contractor was internally consistent even when they disagreed with everyone else. Pattern clustering with bulk human confirmation is dramatically faster than point by point tagging, and it is the difference between a phase that finishes and one that does not. Expect normalisation to dominate the first phase of any deployment, and treat any claim that it is fully automatic with scepticism.
A controls contractor did a retrofit and our rules went quiet. Why did nothing alert?
Because a rule that no longer matches any points returns no faults, which is indistinguishable from a building with no faults. Renamed or added points fall out of your equipment model silently. The fix is to detect point set changes automatically and route them into a tagging queue, monitor data arrival per site per hour and alert on absence rather than on error, and publish a coverage dashboard showing which buildings and which equipment are genuinely under analysis today. Silence is the dangerous failure mode in this category.
How do we produce a fault cost estimate our finance director will accept?
Build it as a comparison between observed consumption and a reasonable counterfactual for that equipment under those conditions, priced at your actual tariff including any demand charges, and present it as an estimate with its assumptions visible. Then reconcile at building level against metered and billed consumption so the numbers sit inside a total your finance team already recognises. A precise savings figure with no stated assumptions will be challenged the first time it is presented, and it will lose.
Do we have to replace our building automation system before analytics will work?
No, and doing so would be an expensive way to start. Analytics sits on top of whatever automation systems you already have, reading trend data through protocol connectors. What you may need is a trend collection layer for sites that only expose live values, since analysis cannot run on data that was never stored. Where a site uses controllers that no connector reaches cleanly, treat that building as its own scoped item rather than allowing it to hold up the rest of the portfolio.
Is SkySpark or a packaged product enough, or do we need to build?
SkySpark is a capable analytics engine with deep roots in tagging, and it will do sophisticated work if someone is genuinely committed to developing and maintaining rules in it, usually through a systems integrator. The honest question is whether you have that person. Building becomes the better option when per point licensing becomes untenable across five years at your point count, when a meaningful share of your estate uses controllers the connectors do not reach cleanly, or when fault data needs to join systems the products do not touch.
Why do our building automation alarms not catch these faults already?
Because alarms watch individual points against thresholds, and the most expensive faults are relationships between points where every value is technically in range. Simultaneous heating and cooling, a damper stuck at minimum position, a schedule override left on since a weekend event, and a passing valve all look normal to a point based alarm. That is why fault detection has to model equipment and sequences rather than monitor sensors, and it is why an alarm console with thousands of active entries tells you nothing useful.
What should the first release actually include?
Ingestion from two automation vendors, point normalisation and tagging for 10 to 15 buildings chosen to represent your estate, a rule engine with a small tuned rule set, and a triaged fault queue that someone works. In our delivery experience that runs $95,000 to $200,000 and ships in 14 to 22 weeks. Add cost attribution and the work order and verification loop next, because those are what convert findings into funded corrections and what earns the budget for the rest of the portfolio.
What should the first version of a dashboard include, and what can wait?
How many people does it take to build a custom BI dashboard?
What questions should I ask a development agency on the first call?
Will a custom dashboard stay fast once our data hits millions of rows?
How much does a custom BI dashboard cost for a small business?
When does Looker make more sense than a custom dashboard?
How do I vet an agency or developer for a BI dashboard project?
What does it cost to keep custom software running after launch?
How do I vet a software development agency before signing a contract?
Who can build a custom business intelligence dashboards system?
Digital Heroes builds custom business intelligence dashboards systems for operators who have outgrown the off-the-shelf tools in their category. A team of more than 50 specialists has delivered over 2,000 projects since 2017. Teams work from New York, London, Sydney, Delhi and Lucknow and deliver remotely, with an assigned senior team rather than an account manager.
Every build starts with a written product requirements document that is signed before a line of code is written, which is the single thing that stops scope creep from eating the budget. Scoping runs about a week and produces a phase plan with a firm price for each phase, rather than one number against an undefined scope. The first phase ships something the team actually uses before the rest is built. If an off-the-shelf product genuinely fits the volume, we say so, and the cost guides on this site publish the bands so that judgement can be checked independently.
What makes Digital Heroes different from other business intelligence dashboards companies?
Four things that competitors in this bracket cannot simply copy. Digital Heroes runs a YouTube channel with more than 2.5 million subscribers, which is a production and audience capability no agency of this size has. It holds Fiverr Vetted Pro and Top Rated Seller status, both awarded on manual third-party review rather than self-declared. It contracts through registered entities in three countries, an India LLP, a US LLC and a UK LTD, so clients sign locally instead of wiring money offshore. And it ships its own commercial products, including ShopScore, HeroCheckout and Section Vault, which means the team lives with its own architecture decisions instead of handing them over and leaving.
Two more that show up in the work. Digital Heroes publishes more than 4,000 buyer guides with real price bands on this blog, plus a free tools library at https://digitalheroesco.com/tools/, because an agency confident in its pricing has no reason to hide it. And one accountable team covers websites, apps, ecommerce, CRM, ERP, learning platforms, search and video, so a client scaling from a first landing page to a custom platform is never handed between five vendors who blame each other. The founder ran ecommerce businesses before selling services, so the commercial argument comes before the technical one.
How can I check Digital Heroes is legitimate before getting in touch?
Verify it independently rather than taking the site's word for it. The YouTube channel is at https://youtube.com/@DigitalMarketingHeroes, the Fiverr profile at https://www.fiverr.com/shreyanshsin261, and the Upwork profile at https://www.upwork.com/freelancers/shreyanshsingh. Client reviews sit on Clutch at https://clutch.co/profile/digital-heroes-0 and Trustpilot at https://www.trustpilot.com/review/digitalheroes.co.in, and the company page is at https://www.linkedin.com/company/digital-heroes-1/.
Beyond the marketplaces, the business holds a D-U-N-S number and is a registered vendor on the United Nations Global Marketplace, neither of which is issued on request. Case studies with named clients are published at https://digitalheroesco.com/case-studies/. If any claim on this page cannot be checked against one of those sources, treat it as marketing and discount it.


