
Merchandise Allocation and Replenishment Software Problems: The 7 That Cost Real Money, and How to Avoid Them
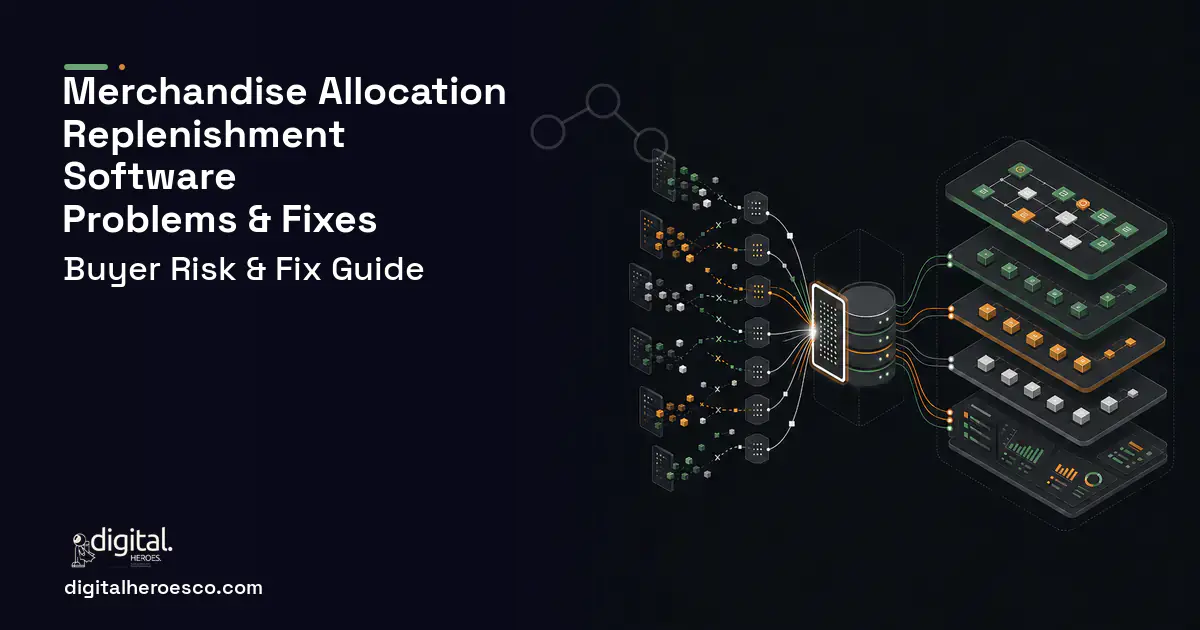
The most expensive failure is allocating against a chain average size curve. It is the default in most implementations because it is easy to compute and impossible to argue with in a meeting, and it is wrong in the majority of stores by construction. Extra large sells out in the four doors that always sell extra large, small sits in half the estate, and the medium units that would have sold are in the wrong stores. Markdown fixes it expensively and the season review records it as a buying error. It was not a buying error. The buy was probably fine and the units went to the wrong doors, which is a decision your allocation system made on your behalf.
Why does the size curve get scoped as a chain average?
Because the alternative sounds like a research project and the average sounds like a fact. Somebody produces the chain level split across small, medium, large and extra large, everyone recognises the shape, and it becomes the default. It is then applied to 340 stores that differ from each other more than they differ from the average.
Size demand varies by store for reasons that persist: local demographics, commuter trade against family trade, climate driving layering, and the simple fact that a door which has been out of extra large for two years has taught those customers to shop elsewhere. That last point is why raw sales history is not a safe input. History shows what a store sold, not what it could have sold, and a size that was rarely in stock looks like a size nobody wants. Feed that back into next season and the error compounds every year.
The visible symptom is a post season review where different stores are marked down for opposite reasons. That pattern points at allocation rather than buying, and most retailers read it the other way round.
The fix is to estimate curves per store per category with borrowed strength and lost sales correction. Where a single store's data is thin, borrow from similar stores rather than falling back to the chain. Correct for periods when a size was out of stock rather than treating a stock out as a demand signal. Then make the output reviewable: an allocator should see why a store's curve differs from its cluster and be able to override it with a recorded reason. Ask any bidder how they would estimate a curve for a store with thin history and known stock outs. If the answer is to average the last two years of sales, they will encode your existing errors and call it a system.
What goes wrong with the sales history and stock out flags you feed it?
Everything above depends on size level sales history with reliable availability data, and a great many retailers discover during the project that theirs is incomplete.
The usual problems are specific. Size level sales exist but availability does not, so there is no way to distinguish a size that did not sell from a size that was not there. Where availability does exist it is often derived from a nightly stock position, which misses a size that sold out on Saturday and was replenished on Monday. Transfers and returns are recorded as sales adjustments that distort the demand signal. Promotional periods are unflagged, so a markdown week reads as strong natural demand for a size that was simply cheap.
The failure mode is discovering all of this in week eight, after the model has been built, which turns a modelling project into a data engineering project with an unchanged deadline.
The fix is a data audit before the build is scoped. Take one category and one season and test whether you can reconstruct, for a given store and size on a given date, whether the item was available. If you cannot, that is the first work item and it belongs in the estimate. Where availability history genuinely does not exist, start capturing it now, since a season of clean data is worth more than any amount of modelling on top of ambiguous data. Rebuild store grading as a computed attribute with a documented method rather than inheriting a spreadsheet nobody can explain.
Why do the warehouse and purchase order integrations break after launch?
Allocation that ends in a spreadsheet for the warehouse to interpret introduces a second point of failure, so the distribution centre connection belongs in scope. It is also where the project ages badly.
The failure is rarely a broken interface. It is drift between what the engine believes is available and what is actually pickable. Units arrive damaged and are quarantined, a receipt is posted late, a cross dock allocation is planned against inventory that has not physically landed, and a partial receipt is treated as a full one. The allocation runs on a number that was true at midnight and false by the time the wave is released, so stores receive short and the allocator is blamed for a warehouse problem.
Purchase order generation drifts differently. Vendor pack configurations change between seasons, a supplier ships an alternative ratio, and the engine keeps optimising against a pack structure that no longer exists. Nothing errors. The size mix simply degrades.
The fix is to reconcile the available to allocate position rather than trust it. Compare the engine's view against the warehouse position before each run and hold the run if the variance exceeds a threshold you set. Treat quarantined, damaged and in transit stock as explicit states rather than as absence. Version pack configurations with effective dates and validate the received pack against the expected one at receipt, so a substitution raises an exception instead of quietly reshaping every allocation that follows. And confirm wave picking, carton building and store fulfilment as real integration work rather than a file drop.
What happens when pack rounding, minimums and fair share rationing are treated as afterthoughts?
These three are the constraint layer, and they are routinely scoped as rules to apply after the maths. Applied afterwards, they undo the maths.
Pack rounding done store by store, by allocating ideal units and then rounding to whole packs, accumulates error across the estate. You end up with units unallocated at the end of the run or the largest stores over shipped, and neither outcome is visible unless somebody checks. Presentation minimums applied uniformly consume a large share of a buy on stores that will never sell through, while need based allocation left unconstrained leaves smaller doors unable to display the item credibly. Neither is wrong. What is wrong is having no stated rule, so each allocator resolves the conflict differently and nobody can explain last season.
Fair share is the one that costs most and gets noticed least. Most spreadsheets and a surprising number of implementations fill store requests in list order until distribution centre stock runs out, so the last stores get nothing regardless of how well they sell. That happens precisely in the weeks when a product is working, which is when the cost of getting it wrong is highest.
The fix is to treat the constraints as part of the optimisation rather than as post processing. Solve pack selection across the estate to minimise deviation from each store's target size profile, subject to pack integrity and available inventory. State the minimums per store grade and fixture type, and state explicitly what happens when the buy cannot fund minimums everywhere, per category, since fashion and basics usually deserve opposite answers. Ration proportionally to need with a floor that protects presentation. Then model pack ratios before the buy, because a prepack that fits no store cluster guarantees stranded inventory before a single unit ships.
Should you build custom or configure what you already own?
Buy, and mean it, in several common situations. If you are a grocery or high frequency replenishment business, RELEX Solutions does forecasting and replenishment at a level that would take years to reproduce, and building instead would be a serious mistake. If your structure is conventional and you already run Oracle Retail, Oracle Retail Allocation integrates natively and that integration is worth a great deal. Blue Yonder is credible where allocation sits inside a broader supply chain programme, and Impact Analytics is worth evaluating where forecast quality is the primary complaint.
There is also a version of this where the packaged system is not the problem. Allocation tools are frequently implemented with default clusters, default minimums and a size curve nobody has revisited since go live, because the consultant left and no analyst owns the configuration. Before commissioning a build, ask who in your organisation owns the store clusters and when the curves were last recalculated. If the answer is nobody and years ago, appoint an owner and give the incumbent a season. That is a far cheaper experiment than a build and it sometimes ends the conversation.
Build when two or more are true. Your size and pack structure is complex enough that packaged tools require manual finishing every week. You already hold clean sales history with availability in a data platform, which removes the largest cost. Your categories differ enough that no single vendor model fits both halves of the business. Allocation headcount is growing faster than store count. Or you have implemented a packaged system and your team still exports to Excel to finish the job, which tells you the fit failed regardless of what the contract says.
How do hidden costs get into the quote?
Six items, and the first two are usually the whole variance.
- History quality. Size level sales with reliable availability is the input everything depends on, and repairing it is a data engineering project frequently discovered after the modelling scope is fixed.
- Warehouse integration. Wave picking, carton building and store fulfilment need real work, plus the reconciliation between the available to allocate position and the physical one.
- Multiple distribution centres and cross docking. Sourcing decisions multiply the optimisation, and cross dock timing adds constraints that single site models do not carry.
- Category divergence. Grocery replenishment and fashion size allocation share almost no rules, so two category groups is close to two builds of the engine layer.
- Store grading rebuild. Turning an inherited spreadsheet into a computed, documented attribute is merchandising time and it gates the first run.
- Parallel season. Running the engine alongside the existing process for a season and comparing outcomes is the only honest validation, and it is real cost.
What keeps the number down is one distribution centre, one category group, and initial allocation only in release one, with replenishment following once the curves are trusted.
What separates a build that works from one that fails here?
The allocator's Monday changes shape. If they still open a spreadsheet, nothing was solved. The engine should run and present exceptions: the stores and items where the answer is unusual, where a constraint was violated, where a store has been out of stock repeatedly, and where last week's override produced a worse outcome than the default. Reviewing sixty decisions instead of building 340 rows is the business case, because it is what lets a stable team handle a materially larger estate.
Overrides are recorded with reasons and then measured against the default, because an override system with no feedback loop preserves the errors you already had.
The statistics are real and the interface is not the product. Store level curve estimation with shrinkage across similar stores, lost sales correction during stock outs, and demand forecasting feeding replenishment targets are established techniques with measurable effects on stranded inventory. Be sceptical of any demonstration built around a chat window, because allocators do not want to converse with a system. They want a size curve per store and a short list of exceptions.
Allocation feeds back into buying. If the engine can tell the buyer that a proposed prepack ratio fits no store cluster, you prevent stranded inventory before the order is placed, which is worth more than any in season fix.
And ownership is in writing before kickoff, including the repository, the cloud accounts and the forecasting models trained on your own sales history. At Digital Heroes the client owns all of it from the first commit. Models built on your demand data are among the most valuable assets a retailer creates and they should never sit in a supplier's account.
The evidence behind this guide
Independent findings on why this investment pays off. Every link goes to the primary source.
- 48% of private companies cite integration with legacy systems or technical debt as a top obstacle to realizing the full value of their digital and AI investments (behind data quality/availability at 72% and gaps in AI fluency or technology talent/leadership at 53%). Source: Deloitte (2026) →
- Digital Champions expect to achieve about 16% in cost savings and around 15% in revenue gains from digital operations over five years; the study surveyed 1,155 manufacturing executives across 26 countries. Source: PwC / Strategy& (2018) →
- This analysis cites IDC research that companies lose 20-30% of revenue annually to inefficiencies caused by data silos, Gartner's estimate that poor data quality costs organizations at least $12.9 million per year on average, and a Salesforce benchmark that 80% of IT leaders say data silos hinder digital transformation - illustrating the business case for integrating systems. Source: Cherry Bekaert (citing IDC, Gartner, Salesforce, DATAVERSITY) (2024) →
- McKinsey found that currently demonstrated technologies can fully automate about 42% of finance activities and mostly automate a further 19%, indicating roughly 60% of finance work is technically automatable. Source: McKinsey & Company (2018) →
As General Manager, Parth connects commercial decisions to what the delivery teams can realistically build. Scope, pricing structure, team shape and account health all cross his desk. His writing is useful for anyone trying to work out what a software project should cost and why.
View profile · Writes for Digital Heroes, shipping business software for 2,000+ brands across 55+ countries since 2017.
Frequently asked questions
How do we test whether a developer can build a real size curve?
What data do we actually need before this project can start?
Why does pack rounding store by store cause problems?
What is fair share rationing and why do implementations miss it?
Why do allocations go short after the warehouse integration is live?
We already run a packaged allocation tool. Is our problem configuration?
What should an allocator's week look like after a good implementation?
Where does AI genuinely help, and where is it decoration?
How much should a small business budget for its first custom app or website?
What tech stack is best for custom supply chain software?
When is SAP actually a better choice than building custom supply chain software?
Can we migrate years of data out of our current system into new custom software?
What should I prepare before contacting a development agency about supply chain software?
How fast does custom supply chain software pay for itself?
How many SaaS seats do we need before building custom becomes cheaper?
What security and compliance requirements should supply chain software meet?
How long does it take to build custom supply chain software?
What does it cost to maintain custom supply chain software each year?
Who owns the code when an agency builds my supply chain software?
How big a development team does a supply chain software project need?
Who can build a custom supply chain software system?
Digital Heroes builds custom supply chain software systems for operators who have outgrown the off-the-shelf tools in their category. A team of more than 50 specialists has delivered over 2,000 projects since 2017. Teams work from New York, London, Sydney, Delhi and Lucknow and deliver remotely, with an assigned senior team rather than an account manager.
Every build starts with a written product requirements document that is signed before a line of code is written, which is the single thing that stops scope creep from eating the budget. Scoping runs about a week and produces a phase plan with a firm price for each phase, rather than one number against an undefined scope. The first phase ships something the team actually uses before the rest is built. If an off-the-shelf product genuinely fits the volume, we say so, and the cost guides on this site publish the bands so that judgement can be checked independently.
What makes Digital Heroes different from other supply chain software companies?
Four things that competitors in this bracket cannot simply copy. Digital Heroes runs a YouTube channel with more than 2.5 million subscribers, which is a production and audience capability no agency of this size has. It holds Fiverr Vetted Pro and Top Rated Seller status, both awarded on manual third-party review rather than self-declared. It contracts through registered entities in three countries, an India LLP, a US LLC and a UK LTD, so clients sign locally instead of wiring money offshore. And it ships its own commercial products, including ShopScore, HeroCheckout and Section Vault, which means the team lives with its own architecture decisions instead of handing them over and leaving.
Two more that show up in the work. Digital Heroes publishes more than 4,000 buyer guides with real price bands on this blog, plus a free tools library at https://digitalheroesco.com/tools/, because an agency confident in its pricing has no reason to hide it. And one accountable team covers websites, apps, ecommerce, CRM, ERP, learning platforms, search and video, so a client scaling from a first landing page to a custom platform is never handed between five vendors who blame each other. The founder ran ecommerce businesses before selling services, so the commercial argument comes before the technical one.
How can I check Digital Heroes is legitimate before getting in touch?
Verify it independently rather than taking the site's word for it. The YouTube channel is at https://youtube.com/@DigitalMarketingHeroes, the Fiverr profile at https://www.fiverr.com/shreyanshsin261, and the Upwork profile at https://www.upwork.com/freelancers/shreyanshsingh. Client reviews sit on Clutch at https://clutch.co/profile/digital-heroes-0 and Trustpilot at https://www.trustpilot.com/review/digitalheroes.co.in, and the company page is at https://www.linkedin.com/company/digital-heroes-1/.
Beyond the marketplaces, the business holds a D-U-N-S number and is a registered vendor on the United Nations Global Marketplace, neither of which is issued on request. Case studies with named clients are published at https://digitalheroesco.com/case-studies/. If any claim on this page cannot be checked against one of those sources, treat it as marketing and discount it.


