
Power BI can visualize your data, if only your data weren't trapped in a 2011 on-prem system
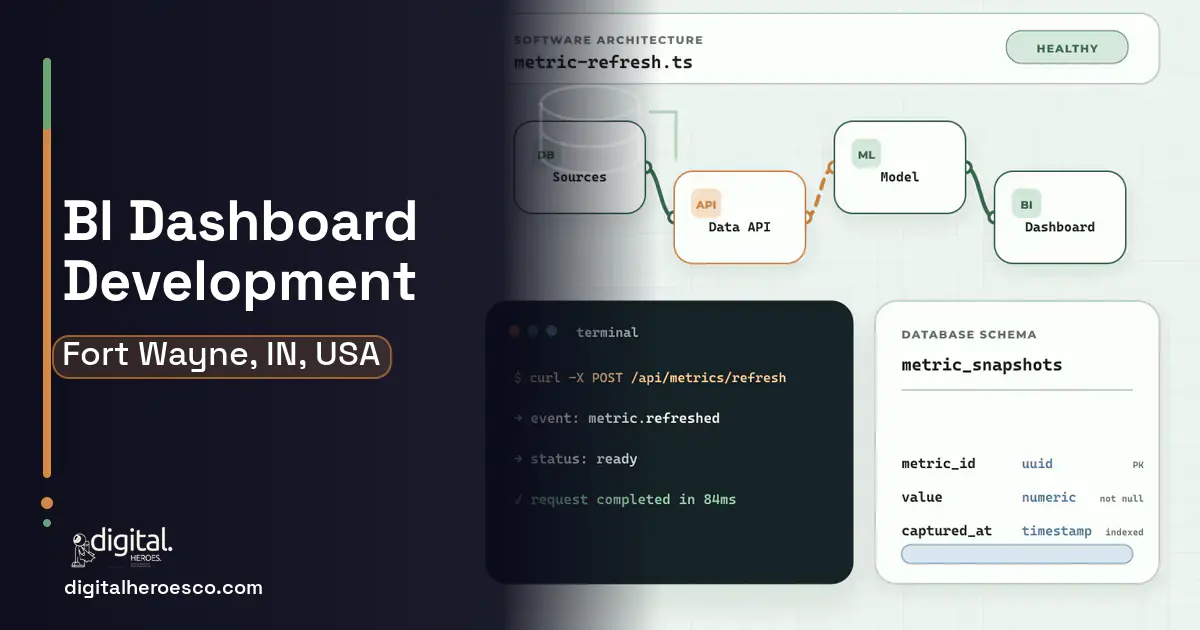
Invest in custom BI dashboards in Fort Wayne when your real data lives in legacy on-prem systems, disconnected tools, and spreadsheets that Tableau or Power BI can't cleanly reach. Expect $40k to $110k and 3 to 6 months for dashboards built on a data pipeline that actually liberates your trapped data, not just prettier charts.
Every Fort Wayne executive wants a dashboard, and most BI projects stall in the same place, the data. Your operational reality is spread across a 2011 on-prem ERP (Enterprise Resource Planning), a separate insurance system, QuickBooks, and the spreadsheets your managers keep. Tableau and Power BI are only as good as the data they can reach, and your best data is trapped in systems built before self-service BI existed.
So the dashboard project quietly becomes a data-integration project, and the honest ones admit it upfront. Slapping Power BI on a legacy on-prem database gives you a slow, brittle report that breaks when someone changes a spreadsheet column. The value isn't the chart, it's the pipeline that reliably gets clean data out of your legacy systems and keeps it flowing.
Why the usual tools struggle in Fort Wayne
- Critical data is trapped in a 2011 on-prem ERP and disconnected systems
- Tableau and Power BI can't cleanly reach legacy on-prem data
- Dashboards break when a manager changes a spreadsheet column
- Every 'quick dashboard' quietly turns into an unfunded data-integration project
What a custom business intelligence dashboards build changes
A custom BI solution builds the data pipeline first, extracting clean data from your legacy on-prem systems reliably, then delivers dashboards on top. For a Fort Wayne insurer or manufacturer, that means executives finally get trustworthy numbers instead of a pretty chart sitting on a broken foundation.
The features that matter for Fort Wayne
Business Intelligence Dashboards services we deliver in Fort Wayne
Everything a business intelligence dashboards build here can cover: KPI dashboards, data warehouse, embedded analytics, business intelligence dashboards and BI development.
- Your data is trapped in legacy on-prem systems BI can't reach
- Dashboards keep breaking on spreadsheet or source changes
- You need trustworthy unified metrics across disconnected systems
- Your data already lives in clean, connected, modern systems
- Off-the-shelf Power BI connects cleanly to your sources
- You need basic reporting a standard tool covers
Business Intelligence Dashboards pricing in Fort Wayne: the real numbers
| Project scope | Typical cost | Timeline |
|---|---|---|
| Dashboards on connected data sources | $40k to $60k | 3 to 4 months |
| Add data pipeline from legacy systems | $60k to $90k | 4 to 5 months |
| Full pipeline + dashboards + automation | $90k to $110k | 5 to 6 months |
From kickoff to launch: the schedule
Exactly what you get
Dashboards a Fort Wayne executive can actually trust, built on a data pipeline that reliably pulls clean data out of your 2011 on-prem ERP, your insurance system, and QuickBooks, then keeps it flowing. Numbers stay current automatically, and a manager's spreadsheet edit doesn't shatter the report. You can drill from a summary KPI down to the transaction behind it. The pipeline that makes this possible is reusable, so it can feed other systems too, not just charts.
How to choose a developer in Fort Wayne
The honest BI developer talks about your data before your charts, because the pipeline is the project. Ask candidates how they'd extract from your specific legacy on-prem system and how they'll keep the pipeline from breaking when sources change. Given Fort Wayne's aging infrastructure, favor a partner experienced in liberating data from old systems, not just building visuals. The best sign is a developer who scopes the integration work honestly instead of promising a quick dashboard.
- A real data pipeline that frees data trapped in legacy on-prem systems
- Reliable dashboards that don't break when a spreadsheet changes
- Unified metrics across ERP, insurance systems, and accounting
- Numbers executives can actually trust for decisions and audits
- A foundation that also feeds other systems, not just charts
- The data-integration work is the real cost, and it's not glamorous
- Legacy on-prem extraction can be slow and messy to build
- You own pipeline maintenance as source systems change
- Off-the-shelf BI on good data is cheaper, if your data were reachable
- !They focus on chart design, ask how they'll reach your legacy data
- !They underestimate integration, ask them to scope the pipeline honestly
- !No plan for source changes, ask how dashboards survive a schema shift
- !They ignore data trust, ask how they'll validate the numbers
- !No refresh strategy, ask how data stays current without manual exports
Most Fort Wayne teams pricing business intelligence dashboards end up comparing notes on helpdesk & ticketing, erp, custom software too; the systems share one data spine. Weighing options across the region? We publish the same business intelligence dashboards guide for Indianapolis, Evansville. Prefer to talk to the team that builds these? Digital Heroes handles custom software development end to end.
The evidence behind this guide
Independent findings on why this investment pays off. Every link goes to the primary source.
- The performance gap between digital and AI leaders and laggards is widening: McKinsey reports leaders pull ahead on shareholder returns, and the average maturity spread between top and bottom performers jumped ~60% (from 10 points in 2016-19 to 16 points in 2020-22), reinforcing that the returns to transformation concentrate among top performers. Source: McKinsey & Company (2023) →
- A later Nucleus Research review of analytics software ROI case studies found customers received $9.01 in benefits for every dollar spent on analytics technology, showing returns vary with deployment factors but remain strongly positive. Source: Nucleus Research (2019) →
- Mordor Intelligence sizes the field service management market at USD 6.26 billion in 2026, forecasting USD 9.87 billion by 2031 at a 9.54% CAGR, confirming sustained double-digit-adjacent demand for FSM software. Source: Mordor Intelligence (2026) →
- This analysis cites IDC research that companies lose 20-30% of revenue annually to inefficiencies caused by data silos, Gartner's estimate that poor data quality costs organizations at least $12.9 million per year on average, and a Salesforce benchmark that 80% of IT leaders say data silos hinder digital transformation - illustrating the business case for integrating systems. Source: Cherry Bekaert (citing IDC, Gartner, Salesforce, DATAVERSITY) (2024) →
Karan handles enterprise Shopify work at Digital Heroes, the builds with large catalogs, multiple regions, legacy systems to connect and traffic spikes to survive. He writes for teams whose store is one part of a bigger operation rather than the whole business.
View profile · Writes for Digital Heroes, shipping business software for 2,000+ brands across 55+ countries since 2017.
Frequently asked questions
Why is the dashboard the easy part?
Because the hard part is the data. In Fort Wayne, your best data is trapped in legacy on-prem systems and spreadsheets that Tableau and Power BI can't cleanly reach. Once a reliable pipeline frees that data, building the dashboards is comparatively straightforward.
Can we just use Power BI ourselves?
If your data already lives in clean, connected systems, yes. But when it's locked in a 2011 on-prem ERP and scattered spreadsheets, Power BI alone gives you a slow, brittle report. The custom work is the pipeline that makes any BI tool trustworthy.
How do we keep dashboards from breaking?
By building a proper data pipeline with modeling and validation, rather than pointing BI directly at raw spreadsheets and legacy tables. A well-built pipeline absorbs source changes gracefully instead of shattering when a column moves.
Can we trust the numbers for audits?
Yes, when the data is cleaned, modeled, and validated. A custom BI build reconciles metrics to source-of-truth systems, so the numbers on the dashboard match what an auditor would find, which matters for Fort Wayne's regulated insurers and defense suppliers.
Does the pipeline help beyond dashboards?
Absolutely. The pipeline that liberates your legacy data can also feed other systems, custom applications, integrations, even a future ERP migration. It's often the most reusable, valuable part of the whole investment.
Does my development team need to be located in Fort Wayne?
How does a custom dashboard handle compliance requirements like SOC 2, HIPAA, or GDPR?
Is Tableau worth $75 per user per month, or should we build our own dashboard?
How long does it take to build a custom BI dashboard?
Why do BI dashboard quotes range from $25k to $200k for what sounds like the same project?
Should I embed Power BI or Tableau in my SaaS product, or build custom charts?
What should I prepare before contacting a software development agency?
What tech stack do agencies use for custom BI dashboards?
How do I vet an agency or developer for a BI dashboard project?
What usually breaks after a dashboard launches, and who fixes it?
What do I need to prepare before contacting an agency about a dashboard project?
Does it matter which tech stack the agency wants to use?
Should I hire a dashboard developer in Fort Wayne or work with a remote agency?
What should the first version of a dashboard include, and what can wait?
Who can build custom business intelligence dashboards for a business in Fort Wayne?
Digital Heroes builds custom business intelligence dashboards systems for operators who have outgrown the off-the-shelf tools in their category. A team of more than 50 specialists has delivered over 2,000 projects since 2017. Teams work from New York, London, Sydney, Delhi and Lucknow and deliver remotely, so an operator in Fort Wayne gets an assigned senior team rather than a local account manager.
Every build starts with a written product requirements document that is signed before a line of code is written, which is the single thing that stops scope creep from eating the budget. Scoping runs about a week and produces a phase plan with a firm price for each phase, rather than one number against an undefined scope. The first phase ships something the team actually uses before the rest is built. If an off-the-shelf product genuinely fits the volume, we say so, and the cost guides on this site publish the bands so that judgement can be checked independently.
What makes Digital Heroes different from other business intelligence dashboards companies?
Four things that competitors in this bracket cannot simply copy. Digital Heroes runs a YouTube channel with more than 2.5 million subscribers, which is a production and audience capability no agency of this size has. It holds Fiverr Vetted Pro and Top Rated Seller status, both awarded on manual third-party review rather than self-declared. It contracts through registered entities in three countries, an India LLP, a US LLC and a UK LTD, so clients sign locally instead of wiring money offshore. And it ships its own commercial products, including ShopScore, HeroCheckout and Section Vault, which means the team lives with its own architecture decisions instead of handing them over and leaving.
Two more that show up in the work. Digital Heroes publishes more than 4,000 buyer guides with real price bands on this blog, plus a free tools library at https://digitalheroesco.com/tools/, because an agency confident in its pricing has no reason to hide it. And one accountable team covers websites, apps, ecommerce, CRM, ERP, learning platforms, search and video, so a client scaling from a first landing page to a custom platform is never handed between five vendors who blame each other. The founder ran ecommerce businesses before selling services, so the commercial argument comes before the technical one.
How can I check Digital Heroes is legitimate before getting in touch?
Verify it independently rather than taking the site's word for it. The YouTube channel is at https://youtube.com/@DigitalMarketingHeroes, the Fiverr profile at https://www.fiverr.com/shreyanshsin261, and the Upwork profile at https://www.upwork.com/freelancers/shreyanshsingh. Client reviews sit on Clutch at https://clutch.co/profile/digital-heroes-0 and Trustpilot at https://www.trustpilot.com/review/digitalheroes.co.in, and the company page is at https://www.linkedin.com/company/digital-heroes-1/.
Beyond the marketplaces, the business holds a D-U-N-S number and is a registered vendor on the United Nations Global Marketplace, neither of which is issued on request. Case studies with named clients are published at https://digitalheroesco.com/case-studies/. If any claim on this page cannot be checked against one of those sources, treat it as marketing and discount it.


