
Business Intelligence Dashboards in Kansas City, KS That Load Before First Shift Starts Asking Questions
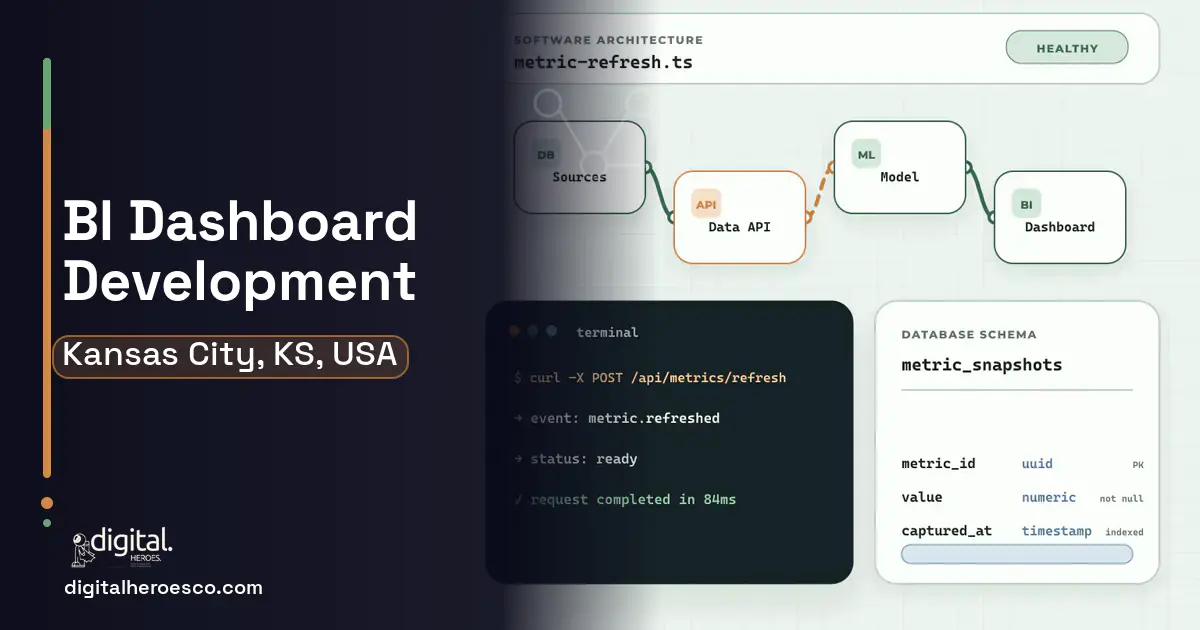
Custom business intelligence dashboards for a Kansas City, KS operation run $40,000 to $90,000 and go live in 8 to 14 weeks. The deliverable that matters is specific: by 6 am, before first shift huddles, one screen shows yesterday's throughput, today's commitments, and the three numbers that are off, pulled automatically from systems that currently do not speak: the WMS (Warehouse Management System), the clocks, QuickBooks, and the carrier feeds.
Your morning meeting argues about numbers instead of acting on them. Ops quotes the WMS, finance quotes QuickBooks, the customer scorecard quotes a portal nobody checks until it hurts, and the spreadsheet that reconciles them is maintained by one analyst two days behind. Power BI and Tableau were bought to fix this, and they became one more skill bottleneck: the licenses are per user at published rates, the one person who can edit the workbook is busy, and the refresh fails silently on weekends.
The deeper problem is that BI tools assume the hard part is visualization. In an operational business the hard part is plumbing: getting clean, reconciled data out of a WMS, a time clock, an accounting file, and a half-dozen carrier feeds, every night, without a human in the loop. Charts are the last ten percent. When the plumbing does not exist, every dashboard is a hand-fed pet that dies the week its keeper goes on vacation.
Why the usual tools struggle in Kansas City
- Morning meetings spent reconciling sources instead of deciding anything
- One analyst as a single point of failure for every number leadership sees
- Per-seat BI licensing that keeps supervisors and leads data-blind
- Silent refresh failures that surface as wrong numbers in front of a customer
What a custom business intelligence dashboards build changes
The build is mostly pipeline, deliberately: automated extraction from your ERP (Enterprise Resource Planning), WMS, accounting software, and clocks into one warehouse of reconciled truth, then dashboards on top that anyone can read without a license fee. Metrics get defined once, in writing, with finance and ops agreeing on the formula, which quietly ends the meeting arguments. Alerting pushes exceptions to phones, so the dashboard is checked when something needs deciding, not out of anxiety. Unlimited screens on the floor, in the office, in the truck, at no marginal cost.
The features that matter for Kansas City
What we build under business intelligence dashboards in Kansas City
Digital Heroes builds the full business intelligence dashboards stack for Kansas City teams. Typical engagements cover Power BI, Looker, real-time analytics, KPI dashboards, data warehouse and embedded analytics.
- Two or more systems disagree about numbers leadership acts on
- An analyst spends two-plus days weekly assembling recurring reports
- Per-seat licensing is rationing data access below the supervisor level
- A customer scorecard surprised you in the last two quarters
- One clean data source and simple charts: Power BI alone is genuinely sufficient
- No one will own metric definitions; tooling cannot referee unresolved politics
- Your source systems are about to be replaced; build the pipeline against the new stack
- Budget under $30,000: start with disciplined manual reporting and graduate
Business Intelligence Dashboards pricing in Kansas City: the real numbers
| Project scope | Typical cost | Timeline |
|---|---|---|
| Pipeline plus core operations dashboard | $40,000 to $60,000 | 8 to 10 weeks |
| Multi-source warehouse with alerting | $60,000 to $75,000 | 10 to 12 weeks |
| Full metrics platform with scorecards | $75,000 to $90,000 | 12 to 16 weeks |
From kickoff to launch: the schedule
Exactly what you get
Plumbing you never think about and screens you check on purpose: automated pipelines from every agreed source, a metrics layer where each number has one definition and one owner, dashboards for floor, supervisors, and ownership, and alerting that pushes exceptions instead of waiting to be noticed. Deliverables include all pipeline code and infrastructure in your accounts, the metric definition document signed by finance and ops, dashboard access for unlimited users, and monitoring that pages us when a refresh fails at 3 am. The first deliverable is deliberately small, five numbers everyone already argues about, reconciled and live, because trust in the system is built one agreed number at a time.
How to choose a developer in Kansas City
Hire for the pipeline, not the palette. Ask candidates how they would extract nightly data from your specific systems, and listen for realism about the ugly ones, the WMS with no API, the accounting file that locks during backups. Ask what happens when two sources disagree, and expect reconciliation rules with a human escalation path, not a shrug. Ask how metric definitions get governed after launch, because the formula for on-time delivery will be contested the week someone misses it. Prefer shops that push alerting over dashboard sprawl; the operational win is exceptions finding people, not people finding screens. And check one boring reference question: a year later, does the 6 am brief still land, and who fixed it the last time it did not.
- One agreed number set by 6 am, ending the whose-spreadsheet-is-right ritual
- No per-seat fees: every supervisor, lead, and manager sees the data
- Pipeline monitoring means failures page us, not surprise you in a customer meeting
- Metric definitions documented and version-controlled, so the formula argument happens once
- Floor-visible screens change behavior in ways monthly reports never have
- Dirty source data gets exposed, not fixed; expect an uncomfortable first month of truth
- Pipelines need ongoing care as source systems update and drift
- If you only need charts on one clean spreadsheet, Power BI at its published per-user price is the honest answer
- Dashboards inform decisions; they do not make them, and screens without operating discipline become wallpaper
- !They open with chart galleries; ask about extraction from your ugliest system first
- !No written metric definitions in the process; the formula fight will just move into the dashboard
- !Refresh failure handling is unspecified; ask who finds out first when a pipeline breaks, you or them
- !They promise real-time everything; ask which metrics actually need it and what latency costs
- !No conversation about who owns each number; dashboards without owners decay into wallpaper
Teams investing in business intelligence dashboards in Kansas City usually scope it next to helpdesk & ticketing, erp, custom software, since these systems share data and budgets. Weighing options across the region? We publish the same business intelligence dashboards guide for Wichita, Overland Park, Olathe. Want it built, not just budgeted? That is our custom software development practice.
The evidence behind this guide
Independent findings on why this investment pays off. Every link goes to the primary source.
- A later Nucleus Research review of analytics software ROI case studies found customers received $9.01 in benefits for every dollar spent on analytics technology, showing returns vary with deployment factors but remain strongly positive. Source: Nucleus Research (2019) →
- In a survey of 113 supply chain leaders (conducted late March to mid-April 2022), 67% had implemented digital dashboards for end-to-end visibility, and those companies were about twice as likely as others to avoid supply chain problems during the disruptions of early 2022; 71% expected to revise inventory policies going forward. Source: McKinsey & Company (2022) →
- Bersin by Deloitte research found organizations that use HR technology and employee-centric design to build a flexible, empowering workplace are more than 5 times more effective at improving employee engagement and retention than their peers, and 2.5 times more likely to reach 'high-impact' status by leveraging HR for digital transformation. Source: Bersin by Deloitte (2017) →
- In an RCT, the no-show rate was 23.5% for patients receiving a text-message reminder versus 38.1% for the control group - a 14.6 percentage-point reduction (p = 0.04). Source: Clinical Pediatrics / PubMed Central (Lin et al.) (2016) →
Sara works on Shopify builds at Digital Heroes, turning design files into working storefronts and adjusting them once traffic reveals what shoppers actually do. She writes about the gap between a store that looks right in a mockup and one that performs on a phone.
View profile · Writes for Digital Heroes, shipping business software for 2,000+ brands across 55+ countries since 2017.
Frequently asked questions
What do custom BI dashboards cost for a Kansas City, KS operation?
Builds run $40,000 to $90,000 in our delivery experience, with a multi-source platform plus alerting near $65,000. The count and quality of source systems drives cost more than the number of charts ever does.
How is this different from just buying Power BI?
Power BI is a visualization layer at a published per-user price; your problem is upstream, in extraction and reconciliation across systems that disagree. We build the pipeline and metrics layer, and unlimited users read the result without seat fees. Some clients keep Power BI on top for analysts, which is a fine hybrid.
Can it pull from our WMS, QuickBooks, and time clocks together?
Yes, that trio is the standard KCK starting lineup, joined by carrier feeds where they exist. Each source gets an automated extract, and the metrics layer reconciles them into numbers finance and ops both sign.
What happens when a data refresh fails overnight?
Monitoring catches it and pages our on-call before your morning meeting, with the affected dashboards flagged as stale rather than silently wrong. Silent wrongness is the cardinal BI sin; we engineer specifically against it.
How fast can we see the first live dashboard?
The first reconciled screen, typically five contested numbers, lands around week six, with the full platform live by week 10 to 14. Shipping a small trusted thing early beats shipping a big doubted thing late.
Can floor supervisors see dashboards without licenses?
Yes, unlimited users is a core economic advantage of building: wall screens on the floor, phone views for leads, and the owner's daily brief all come at zero marginal seat cost.
Who defines what counts as on-time or utilization?
You do, once, in writing, during discovery, with finance and ops in the same room. We facilitate and document; the signed definitions become part of the codebase, and changing one is a versioned decision rather than a quiet edit.
What are the ongoing costs?
Hosting for a platform this size typically runs $100 to $400 monthly, and support at $800 to $2,000 monthly covers pipeline upkeep as your source systems drift and change. You own everything and can take maintenance internal whenever it makes sense.
Can it alert us instead of us checking screens?
Yes, and that inversion is most of the value: thresholds your team sets push texts or app alerts when a number leaves its lane, so screens get checked in response to a nudge. Dashboards you must remember to check are half a solution.
What do I need to prepare before contacting an agency about a dashboard project?
How do I calculate whether custom software will pay for itself?
Who owns the code when an agency builds my software?
Should I embed Power BI or Tableau in my SaaS product, or build custom charts?
How many SaaS seats do we need before building custom becomes cheaper?
Is custom software more secure than off-the-shelf SaaS?
Who can build custom business intelligence dashboards for a business in Kansas City?
Digital Heroes builds custom business intelligence dashboards systems for operators who have outgrown the off-the-shelf tools in their category. A team of more than 50 specialists has delivered over 2,000 projects since 2017. Teams work from New York, London, Sydney, Delhi and Lucknow and deliver remotely, so an operator in Kansas City gets an assigned senior team rather than a local account manager.
Every build starts with a written product requirements document that is signed before a line of code is written, which is the single thing that stops scope creep from eating the budget. Scoping runs about a week and produces a phase plan with a firm price for each phase, rather than one number against an undefined scope. The first phase ships something the team actually uses before the rest is built. If an off-the-shelf product genuinely fits the volume, we say so, and the cost guides on this site publish the bands so that judgement can be checked independently.
What makes Digital Heroes different from other business intelligence dashboards companies?
Four things that competitors in this bracket cannot simply copy. Digital Heroes runs a YouTube channel with more than 2.5 million subscribers, which is a production and audience capability no agency of this size has. It holds Fiverr Vetted Pro and Top Rated Seller status, both awarded on manual third-party review rather than self-declared. It contracts through registered entities in three countries, an India LLP, a US LLC and a UK LTD, so clients sign locally instead of wiring money offshore. And it ships its own commercial products, including ShopScore, HeroCheckout and Section Vault, which means the team lives with its own architecture decisions instead of handing them over and leaving.
Two more that show up in the work. Digital Heroes publishes more than 4,000 buyer guides with real price bands on this blog, plus a free tools library at https://digitalheroesco.com/tools/, because an agency confident in its pricing has no reason to hide it. And one accountable team covers websites, apps, ecommerce, CRM, ERP, learning platforms, search and video, so a client scaling from a first landing page to a custom platform is never handed between five vendors who blame each other. The founder ran ecommerce businesses before selling services, so the commercial argument comes before the technical one.
How can I check Digital Heroes is legitimate before getting in touch?
Verify it independently rather than taking the site's word for it. The YouTube channel is at https://youtube.com/@DigitalMarketingHeroes, the Fiverr profile at https://www.fiverr.com/shreyanshsin261, and the Upwork profile at https://www.upwork.com/freelancers/shreyanshsingh. Client reviews sit on Clutch at https://clutch.co/profile/digital-heroes-0 and Trustpilot at https://www.trustpilot.com/review/digitalheroes.co.in, and the company page is at https://www.linkedin.com/company/digital-heroes-1/.
Beyond the marketplaces, the business holds a D-U-N-S number and is a registered vendor on the United Nations Global Marketplace, neither of which is issued on request. Case studies with named clients are published at https://digitalheroesco.com/case-studies/. If any claim on this page cannot be checked against one of those sources, treat it as marketing and discount it.


