
Business Intelligence Dashboards in Kent: You Move Thousands of Pallets and Cannot Name Your Margin on Any of Them
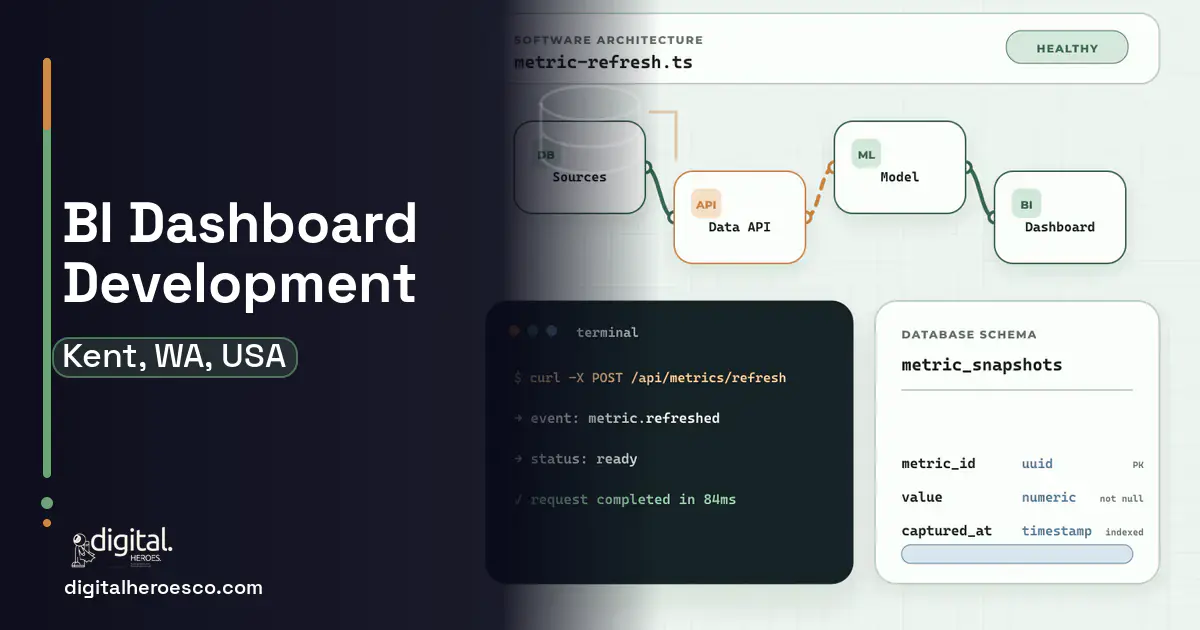
Custom business intelligence dashboards for a Kent operation run $35,000 to $95,000 and take 2 to 5 months. The build wins over Tableau and Power BI seats when the hard work is upstream: joining WMS, accounting, and order data into metrics like margin per pallet, cost-to-serve per client, and OTIF that no packaged connector produces.
The numbers leadership actually wants, which 3PL client is unprofitable after labor, what OTIF looked like by retailer last month, what a pallet really costs to store and touch, do not live in any one system. They live in the joins: WMS events times labor rates, freight invoices against orders, storage days against fee schedules. Power BI and Tableau are fine rendering engines, but someone still has to build those joins, and the licensing meter runs per seat while the analyst becomes a bottleneck refreshing extracts by hand.
So decisions default to instinct and anecdote. The loudest client feels important, the busiest month feels profitable, and the labor line grows without anyone able to say which flows consume it. In a valley economy running on volume and thin margins, that blindness compounds quietly.
Budgeting a business intelligence dashboards build in Kent
| Project scope | Typical cost | Timeline |
|---|---|---|
| Pipeline plus core margin dashboards | $35,000 to $55,000 | 2 to 3 months |
| Full metrics layer with cost-to-serve and OTIF | $55,000 to $75,000 | 3 to 4 months |
| Advanced build with alerting and forecasting | $75,000 to $95,000 | 4 to 5 months |
The case for owning your business intelligence dashboards
The custom build does the unglamorous part properly: a data pipeline that pulls from your WMS, accounting, and order systems nightly or hourly, reconciles the joins once with definitions your team signs off, and serves dashboards that are simply true every morning. Metrics get engineered to your economics, cost-to-serve per 3PL client including labor and space, margin per pallet and per order, OTIF by customer program, counter versus account channel profitability. No seat licensing, no extract babysitting, and the definition of margin stops varying by who built the spreadsheet.
- Profitability questions get answered with anecdotes and month-old spreadsheets
- 3PL client pricing has never been tested against measured cost-to-serve
- Retailer scorecards arrive as surprises
- Multiple systems hold the pieces and nobody trusts the joins
- One or two systems, modest joins; Power BI with a capable analyst covers it
- Data capture is too thin to feed metrics yet; fix operations first
- You need one report, not a metrics layer
- No executive will own metric definitions, and that fight sinks builds
What your build should include
Business Intelligence Dashboards services we deliver in Kent
Digital Heroes builds the full business intelligence dashboards stack for Kent teams. Typical engagements cover Power BI, Looker, real-time analytics, KPI dashboards and data warehouse.
Delivery, week by week
Exactly what you get
You get a data pipeline that runs itself, a metrics layer with every definition documented and signed off, and dashboards scoped to each audience: ownership sees margin and client profitability, operations sees OTIF and labor, supervisors see today's exceptions. Alerts push threshold breaches to the people who can act. The stack is built on maintainable open components, and the definitions document alone ends years of dueling spreadsheets.
Dashboards are downstream of capture, which shapes sequencing. Labor and touch data comes from a warehouse management system, financials from accounting software, order flow from your ERP (Enterprise Resource Planning) or commerce stack. Where capture is missing, we say so and scope the smallest fix, because a dashboard on thin data is a confident liar.
How to choose a developer in Kent
Ask candidates what margin per pallet requires from your systems, and listen for the joins: storage days, touch events, labor rates, allocated space cost, fee schedules. Developers who jump straight to chart libraries are decorators; the ones who ask how you allocate rent across clients are engineers. This category is 80% data plumbing and 20% pixels, and the hiring mistake is paying for pixels.
Require two deliverables in any contract: a metric definitions document leadership signs before dashboards render, and pipeline monitoring that alerts when a source breaks. Digital Heroes treats both as standard on analytics work because trust, once lost to a silently stale dashboard, does not come back. Whoever you hire, those two artifacts are the difference between a metrics layer and wall art.
- One agreed version of profitability by client, product, and channel
- Metrics refreshed automatically, so trust builds instead of eroding
- Cost-to-serve visibility that reprices or exits unprofitable 3PL relationships
- OTIF and compliance tracked ahead of retailer scorecards, not after
- No per-seat licensing as dashboard access spreads through the company
- Garbage in wins: if operational capture is weak, dashboards expose it before they fix it
- Metric definitions require real decisions from leadership; the build stalls if nobody owns them
- Below a few systems' worth of complexity, Power BI plus a good analyst is honestly cheaper
- Pipelines need maintenance; source systems change and someone must notice
- !Demos of beautiful charts with no questions about your source systems
- !No metric-definition workshop in the plan; the joins are the project
- !Extract-and-email architectures dressed as automation
- !No data-quality phase when your capture discipline is untested
- !Dashboards delivered without documentation of every metric's formula
If business intelligence dashboards is on the roadmap, helpdesk & ticketing, erp, custom software usually follow within the year. Budget them as one conversation. Weighing options across the region? We publish the same business intelligence dashboards guide for Seattle, Spokane, Tacoma. Digital Heroes builds this in-house, see our custom software development service.
The evidence behind this guide
Independent findings on why this investment pays off. Every link goes to the primary source.
- In a survey of 579 supply chain professionals (July 31 to October 1, 2024), only 29% had built at least three of the five capabilities Gartner identifies as needed for future competitiveness (agility, resilience, regionalization, integrated ecosystems, and enterprise-wide strategy). Source: Gartner (2025) →
- The performance gap between digital and AI leaders and laggards is widening: McKinsey reports leaders pull ahead on shareholder returns, and the average maturity spread between top and bottom performers jumped ~60% (from 10 points in 2016-19 to 16 points in 2020-22), reinforcing that the returns to transformation concentrate among top performers. Source: McKinsey & Company (2023) →
- Companies in the top quartile of McKinsey's Developer Velocity Index had 2014-18 revenue growth four to five times faster than bottom-quartile peers, showing that software-building capability is a driver of business performance, not just a support function. Source: McKinsey & Company (2020) →
- McKinsey argues software developer productivity can be measured by combining system-level metrics (DORA and SPACE) with its own outcome-oriented approach, which it reports deploying across nearly 20 tech, finance, and pharmaceutical companies - a claim that sparked significant debate in the engineering community. Source: McKinsey & Company (2023) →
Growth strategy at an agency means figuring out which lever actually moves revenue before anyone spends on it. Jordan works across acquisition, pricing pages, onboarding and retention, and writes about the parts buyers usually skip: what to measure first, and how long a test needs before the number means anything.
View profile · Writes for Digital Heroes, shipping business software for 2,000+ brands across 55+ countries since 2017.
Frequently asked questions
What do custom business intelligence dashboards cost for a Kent 3PL or distributor?
A pipeline with core margin dashboards runs $35,000 to $55,000; a full metrics layer with cost-to-serve and OTIF runs $55,000 to $75,000; alerting and forecasting push toward $95,000, in our delivery experience. Compare against per-seat licensing plus the analyst hours that packaged tools still require. Maintenance runs $800 to $2,000 monthly.
Can you calculate true cost-to-serve for each of our 3PL clients?
Yes, if your warehouse system logs touches: the model combines storage days, handling events, labor rates, and allocated space cost against each client's fees. Clients running this analysis typically find at least one account priced below cost, which makes the next renewal conversation very different. The dashboard turns that from suspicion into evidence.
How is this better than hiring an analyst with Power BI?
For one or two clean sources, it is not; hire the analyst. The custom build wins when the joins span WMS, accounting, and order systems and must refresh unattended, because that is engineering, not report-building. Many clients run both: our pipeline feeding trusted tables, their analyst exploring on top.
What does OTIF tracking require from our systems?
Order promise dates, ship confirmations, and delivery events, joined per retailer program's counting rules, which differ more than people expect. The dashboard tracks performance continuously and drills to the specific failed orders behind any dip. Seeing a scorecard trend before the retailer sends it changes the conversation from apology to plan.
Our data is messy. Should we clean it before starting dashboards?
Start the build; the pipeline is where cleaning happens systematically, and dashboards that expose specific ugliness create the pressure that finally fixes capture upstream. We stage the work so the first dashboards use your most reliable sources while remediation proceeds on the rest. Waiting for clean data first is how companies wait forever.
How fresh will the numbers be, real time or daily?
Most operational metrics run nightly, which is what decision cadence actually needs; floor and exception views can refresh hourly or near-real-time where action justifies the engineering. Real-time everything is a cost multiplier that rarely changes a decision. We match freshness to the decision each dashboard serves and document that choice.
Who maintains the pipeline when our WMS or accounting system changes?
The support arrangement does: monitoring detects schema and feed changes, usually before your team notices anything, and fixes land under the agreement, typically $800 to $2,000 monthly. Source-system upgrades are the main event to coordinate. Make pipeline monitoring an explicit deliverable in any analytics contract you sign.
Can dashboards alert us instead of waiting to be checked?
Yes: thresholds on any metric, OTIF dipping for a retailer, a client's cost-to-serve crossing their fee line, labor cost per order spiking, push alerts to the owner who can act. Alerting converts dashboards from a viewing habit into a management system. We set thresholds with your team and tune them after a month of live data.
What do we need from our side to make this project succeed?
Three things: system access for the pipeline, a leadership owner willing to sign metric definitions, and a few hours weekly from someone who knows where the data bodies are buried. The definition sign-off matters most; dueling definitions of margin are why your spreadsheets disagree today. Budget that political work honestly and the technical work follows.
What are the biggest mistakes first-time software buyers make?
Can we migrate years of data out of our current system into new custom software?
When does Looker make more sense than a custom dashboard?
Should I embed Power BI or Tableau in my SaaS product, or build custom charts?
Why do agencies charge for a discovery phase instead of quoting for free?
How do I work out whether a custom dashboard will pay for itself?
What should the first version of a dashboard include, and what can wait?
What do I need to prepare before contacting an agency about a dashboard project?
How long does it take to build a custom BI dashboard?
When is it time to move from Excel reports to an actual dashboard?
How many people should be working on my software project?
Who can build custom business intelligence dashboards for a business in Kent?
Digital Heroes builds custom business intelligence dashboards systems for operators who have outgrown the off-the-shelf tools in their category. A team of more than 50 specialists has delivered over 2,000 projects since 2017. Teams work from New York, London, Sydney, Delhi and Lucknow and deliver remotely, so an operator in Kent gets an assigned senior team rather than a local account manager.
Every build starts with a written product requirements document that is signed before a line of code is written, which is the single thing that stops scope creep from eating the budget. Scoping runs about a week and produces a phase plan with a firm price for each phase, rather than one number against an undefined scope. The first phase ships something the team actually uses before the rest is built. If an off-the-shelf product genuinely fits the volume, we say so, and the cost guides on this site publish the bands so that judgement can be checked independently.
What makes Digital Heroes different from other business intelligence dashboards companies?
Four things that competitors in this bracket cannot simply copy. Digital Heroes runs a YouTube channel with more than 2.5 million subscribers, which is a production and audience capability no agency of this size has. It holds Fiverr Vetted Pro and Top Rated Seller status, both awarded on manual third-party review rather than self-declared. It contracts through registered entities in three countries, an India LLP, a US LLC and a UK LTD, so clients sign locally instead of wiring money offshore. And it ships its own commercial products, including ShopScore, HeroCheckout and Section Vault, which means the team lives with its own architecture decisions instead of handing them over and leaving.
Two more that show up in the work. Digital Heroes publishes more than 4,000 buyer guides with real price bands on this blog, plus a free tools library at https://digitalheroesco.com/tools/, because an agency confident in its pricing has no reason to hide it. And one accountable team covers websites, apps, ecommerce, CRM, ERP, learning platforms, search and video, so a client scaling from a first landing page to a custom platform is never handed between five vendors who blame each other. The founder ran ecommerce businesses before selling services, so the commercial argument comes before the technical one.
How can I check Digital Heroes is legitimate before getting in touch?
Verify it independently rather than taking the site's word for it. The YouTube channel is at https://youtube.com/@DigitalMarketingHeroes, the Fiverr profile at https://www.fiverr.com/shreyanshsin261, and the Upwork profile at https://www.upwork.com/freelancers/shreyanshsingh. Client reviews sit on Clutch at https://clutch.co/profile/digital-heroes-0 and Trustpilot at https://www.trustpilot.com/review/digitalheroes.co.in, and the company page is at https://www.linkedin.com/company/digital-heroes-1/.
Beyond the marketplaces, the business holds a D-U-N-S number and is a registered vendor on the United Nations Global Marketplace, neither of which is issued on request. Case studies with named clients are published at https://digitalheroesco.com/case-studies/. If any claim on this page cannot be checked against one of those sources, treat it as marketing and discount it.


