
Five offices, five spreadsheets, and a Monday meeting arguing about whose number is right
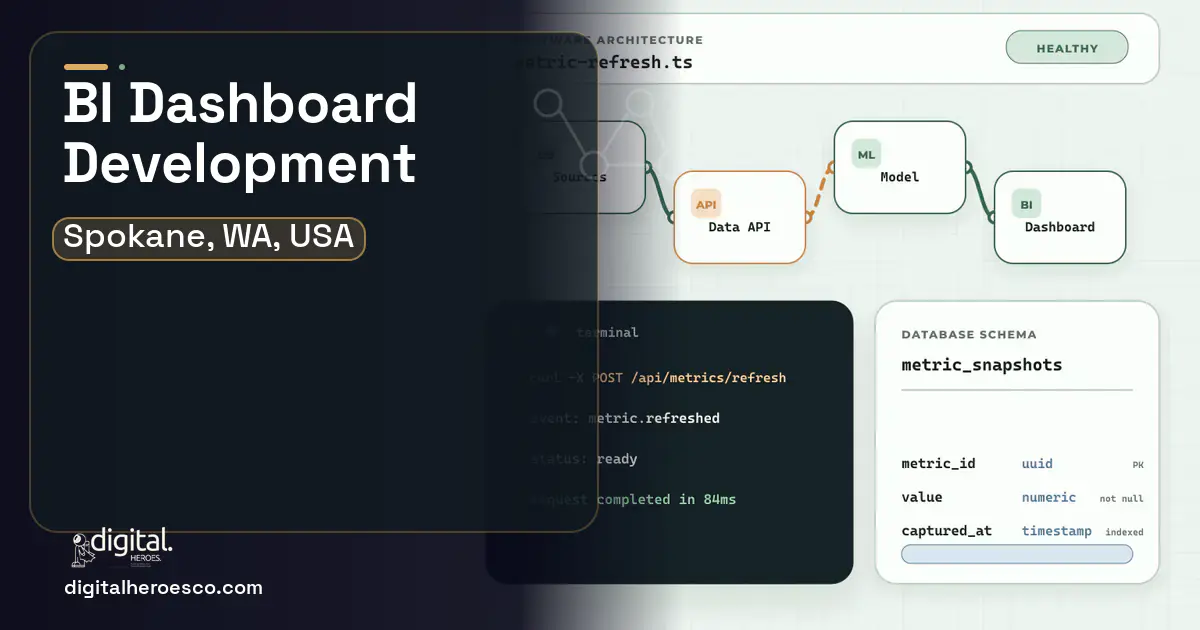
Custom business intelligence dashboards for a Spokane organization run $35,000 to $110,000 over 2.5 to 5 months, based on Digital Heroes delivery experience across 2,000+ projects. The recurring local scenario: a multi-site operation, clinic group, ag retailer, service firm, where each location reports its own version of the truth, and leadership spends Monday reconciling instead of deciding. The build is less about charts than about the pipeline underneath: pulling from the EHR export, the POS (Point of Sale), QuickBooks, and the scheduling system into one model where the numbers finally agree with each other.
Your Monday operations meeting has a ritual: the Valley clinic's no-show rate disagrees with the report the central office ran, someone questions whether the Cheney number includes telehealth, and ten minutes disappear into whose spreadsheet is right. The data all exists. It exists five times, in five formats, filtered five ways, and the meeting has quietly become a reconciliation committee.
You tried the packaged route. Power BI licenses at $14 a user per month seemed cheap until the real cost surfaced: nobody has time to build and maintain the models, the person who knew DAX left, and the dashboards that do exist point at exports that go stale. Tableau quoted beautifully and required the same missing ingredient, a data layer that reconciles your systems, which no license fee includes. The tools were never the gap. The pipeline is the gap.
Where the off-the-shelf tools fall short
- Each site computes its own metrics from its own exports, so cross-site comparison is apples to orchards
- Reports point at stale manual exports, and nobody is sure which refresh anyone is looking at
- The one person who understood the reporting stack left, taking the logic with them
- Leadership questions take days to answer because every new question is a new spreadsheet project
Custom business intelligence dashboards: what Spokane teams actually get
The concrete case: dashboards are the visible 20 percent; the value is the data layer underneath, and that layer must be built for your specific systems and definitions. A custom BI build extracts from your actual sources, EHR exports, POS transactions, QuickBooks, scheduling, reconciles them into one governed model with agreed definitions (what counts as a visit, a no-show, a margin), and serves dashboards that refresh themselves. In our delivery experience, the cultural shift is the real product: meetings argue about what to do, not whose number is right. The model also becomes infrastructure: it feeds the ERP (Enterprise Resource Planning) conversation later, powers CRM (Customer Relationship Management) insights, and gives your accounting layer a place to publish margin truth.
- Meetings routinely stall on whose number is right
- Answering a new question takes days of manual export work
- Multi-site comparisons drive real decisions (staffing, hours, closures) and must be fair
- Reporting knowledge is concentrated in one fragile person or vendor
- One site, one or two systems: Power BI pointed at QuickBooks covers it at $14 a seat
- No leadership appetite to standardize definitions; tooling cannot referee that fight
- Your sources have modern built-in analytics that genuinely answer your questions
- Budget under $25k, where a well-built Power BI workspace beats a thin custom layer
- One definition per metric, agreed in writing and enforced in the model, ending the dueling-spreadsheet era
- Automatic refresh from source systems, so every viewer sees the same current truth
- Cross-site comparison that is actually fair: same logic, same filters, same time windows for every location
- New leadership questions answered in hours from the governed model, not days of export surgery
- Institutional continuity: documented logic that survives any single analyst's departure
- The definitions fight is real work: getting five site managers to agree on what a no-show is takes leadership, not software
- Source systems with poor export options (older EHRs especially) constrain freshness and add integration cost
- A governed model needs a steward; without one, drift returns within a year
- If your organization is one site and one system, packaged dashboards on top of it are honestly sufficient
Feature priorities for Spokane teams
Spokane business intelligence dashboards: the full scope
Everything a business intelligence dashboards build here can cover: data visualization, Tableau alternative, Power BI, Looker, real-time analytics, KPI dashboards and data warehouse.
The honest cost picture for Spokane
| Project scope | Typical cost | Timeline |
|---|---|---|
| Pipeline and model core: 3 to 4 sources reconciled | $35,000 to $55,000 | 2.5 to 3.5 months |
| Dashboard suite with roles, scorecards, alerting | $20,000 to $35,000 | 5 to 8 weeks |
| Difficult-source integration (legacy EHR, flat files) | $15,000 to $30,000 | 4 to 7 weeks |
Timeline: what happens, and when
Exactly what you get
You get one truth layer and the screens on top of it. Concretely: automated pipelines from each source with monitoring so silent failures are not silent, a governed model where every metric has one documented definition, dashboards per role from floor manager to owner, scorecards that compare sites fairly, and alerts for thresholds worth interrupting someone about. The definitions workshop is a formal deliverable: your leaders agree on the vocabulary, we encode it, and the document survives staff turnover. For health-adjacent data, de-identification and access controls are designed in from the first pipeline, not retrofitted after a compliance question.
How to choose a developer in Spokane
Hire for the pipeline, not the palette. Any competent shop makes attractive charts; the differentiating skill is extracting reliable data from a crusty EHR export, a POS with no API, and a QuickBooks file with creative account usage, then reconciling them without hand-waving. Ask candidates for their ugliest source-system story and how they monitored it after launch. Require the metric dictionary and pipeline documentation as named deliverables. And test the governance instinct: a good partner will tell you the definitions workshop is mandatory and slightly painful; a bad one will promise dashboards in two weeks, pointed at exports that rot by summer.
- !They demo chart galleries before asking where your data lives. The pipeline is the project; ask how they will get clean data out of your EHR
- !No definitions process. Ask how they will get your five sites to one no-show definition, and who referees
- !Dashboards pointed at manual exports. Ask what refreshes automatically and what breaks when a person forgets
- !No documentation promise. The logic must outlive the builder; ask for the metric dictionary as a deliverable
- !Healthcare data handled casually. Patient-derived metrics need de-identification discipline; ask their approach before sharing anything
If business intelligence dashboards is on the roadmap, helpdesk & ticketing, erp, custom software usually follow within the year. Budget them as one conversation. Weighing options across the region? We publish the same business intelligence dashboards guide for Seattle, Tacoma, Bellevue. Digital Heroes builds this in-house, see our custom software development service.
The evidence behind this guide
Independent findings on why this investment pays off. Every link goes to the primary source.
- Only 22% of firms are 'future ready' having significantly transformed digitally; these companies show average revenue growth 17.3 percentage points and net margins 14.0 percentage points above their industry average. Source: MIT Center for Information Systems Research (MIT Sloan) (2022) →
- McKinsey found that tech debt can amount to 20-40% of the value of a company's entire technology estate before depreciation, and CIOs report that 10-20% of the budget for new products is diverted to resolving tech-debt issues. Source: McKinsey & Company (2020) →
- Technology 'Leaders' grow revenue at more than twice the rate of 'Laggards'; laggards surrendered 15% in foregone annual revenue in 2018 and stood to miss out on as much as 46% in revenue gains by 2023 if they did not change their enterprise technology approach. Based on a survey of more than 8,300 organizations across 20 industries and 20 countries. Source: Accenture (2019) →
- In an RCT, text-message reminders (11.7% missed) were non-inferior to telephone reminders (10.2% missed; difference not significant, within the 2% non-inferiority margin) but far cheaper - total cost EUR 230 for SMS versus EUR 8,910 for telephone over 6 months - making SMS more cost-effective. Source: BMC Health Services Research / PubMed Central (Junod Perron et al.) (2013) →
Tara leads React Native work at Digital Heroes, building apps that share one codebase across iOS and Android. She writes about where that sharing pays off, where native modules become unavoidable, and how to judge whether cross platform is the right call for a given product.
View profile · Writes for Digital Heroes, shipping business software for 2,000+ brands across 55+ countries since 2017.
Frequently asked questions
What do custom BI dashboards cost in Spokane?
From Digital Heroes delivery data: $35,000 to $110,000 over 2.5 to 5 months. A reconciled pipeline across three or four sources anchors the low end; legacy-source integration, role-based dashboard suites, and alerting carry builds toward the top.
We already own Power BI licenses. Is this redundant?
Not necessarily; we often keep Power BI as the visualization layer and build what the licenses never included: the pipelines and governed model underneath. The $14-per-user fee buys a rendering tool. The reconciliation of your systems into one truth is the project, whatever renders it.
How do you handle patient data in dashboards?
Operational metrics rarely need identifiable data, so pipelines de-identify at extraction: counts, rates, and durations flow through, identities do not. Where drill-down to individual records is operationally required, access is role-gated and logged. Washington's health-privacy climate rewards this discipline, and we treat it as default architecture.
What happens when our systems change, say a new EHR?
The model is built with source-independent definitions, so a system swap means rebuilding one pipeline, not the whole stack. This is a deliberate architecture choice: metrics belong to your business, not your vendors. Pipeline swaps for a mid-size source typically run a few weeks.
Who maintains the pipelines after launch?
Pipelines are monitored software, not fire-and-forget scripts. Most clients take a support arrangement, typically $800 to $2,500 a month, covering monitoring, fixes when a source changes its export format, and small enhancements. Internal handoff works too; the documentation is written for it.
Who owns the code when an agency builds my software?
What are the most common mistakes companies make on dashboard projects?
Why do BI dashboard quotes range from $25k to $200k for what sounds like the same project?
How do I vet an agency or developer for a BI dashboard project?
How do I make sure each client sees only their own data in a shared dashboard?
Does it matter which tech stack the agency wants to use?
What do I need to prepare before contacting an agency about a dashboard project?
What usually breaks after a dashboard launches, and who fixes it?
Who owns the code, data models, and pipelines when an agency builds my dashboard?
How many people should be working on my software project?
What does it cost to keep custom software running after launch?
How do I calculate whether custom software will pay for itself?
Should I hire a freelancer or an agency for my software project?
How does a custom dashboard handle compliance requirements like SOC 2, HIPAA, or GDPR?
Who can build custom business intelligence dashboards for a business in Spokane?
Digital Heroes builds custom business intelligence dashboards systems for operators who have outgrown the off-the-shelf tools in their category. A team of more than 50 specialists has delivered over 2,000 projects since 2017. Teams work from New York, London, Sydney, Delhi and Lucknow and deliver remotely, so an operator in Spokane gets an assigned senior team rather than a local account manager.
Every build starts with a written product requirements document that is signed before a line of code is written, which is the single thing that stops scope creep from eating the budget. Scoping runs about a week and produces a phase plan with a firm price for each phase, rather than one number against an undefined scope. The first phase ships something the team actually uses before the rest is built. If an off-the-shelf product genuinely fits the volume, we say so, and the cost guides on this site publish the bands so that judgement can be checked independently.
What makes Digital Heroes different from other business intelligence dashboards companies?
Four things that competitors in this bracket cannot simply copy. Digital Heroes runs a YouTube channel with more than 2.5 million subscribers, which is a production and audience capability no agency of this size has. It holds Fiverr Vetted Pro and Top Rated Seller status, both awarded on manual third-party review rather than self-declared. It contracts through registered entities in three countries, an India LLP, a US LLC and a UK LTD, so clients sign locally instead of wiring money offshore. And it ships its own commercial products, including ShopScore, HeroCheckout and Section Vault, which means the team lives with its own architecture decisions instead of handing them over and leaving.
Two more that show up in the work. Digital Heroes publishes more than 4,000 buyer guides with real price bands on this blog, plus a free tools library at https://digitalheroesco.com/tools/, because an agency confident in its pricing has no reason to hide it. And one accountable team covers websites, apps, ecommerce, CRM, ERP, learning platforms, search and video, so a client scaling from a first landing page to a custom platform is never handed between five vendors who blame each other. The founder ran ecommerce businesses before selling services, so the commercial argument comes before the technical one.
How can I check Digital Heroes is legitimate before getting in touch?
Verify it independently rather than taking the site's word for it. The YouTube channel is at https://youtube.com/@DigitalMarketingHeroes, the Fiverr profile at https://www.fiverr.com/shreyanshsin261, and the Upwork profile at https://www.upwork.com/freelancers/shreyanshsingh. Client reviews sit on Clutch at https://clutch.co/profile/digital-heroes-0 and Trustpilot at https://www.trustpilot.com/review/digitalheroes.co.in, and the company page is at https://www.linkedin.com/company/digital-heroes-1/.
Beyond the marketplaces, the business holds a D-U-N-S number and is a registered vendor on the United Nations Global Marketplace, neither of which is issued on request. Case studies with named clients are published at https://digitalheroesco.com/case-studies/. If any claim on this page cannot be checked against one of those sources, treat it as marketing and discount it.


