
Business Intelligence Dashboards in San Bernardino: Numbers the Morning Meeting Can Actually Run On
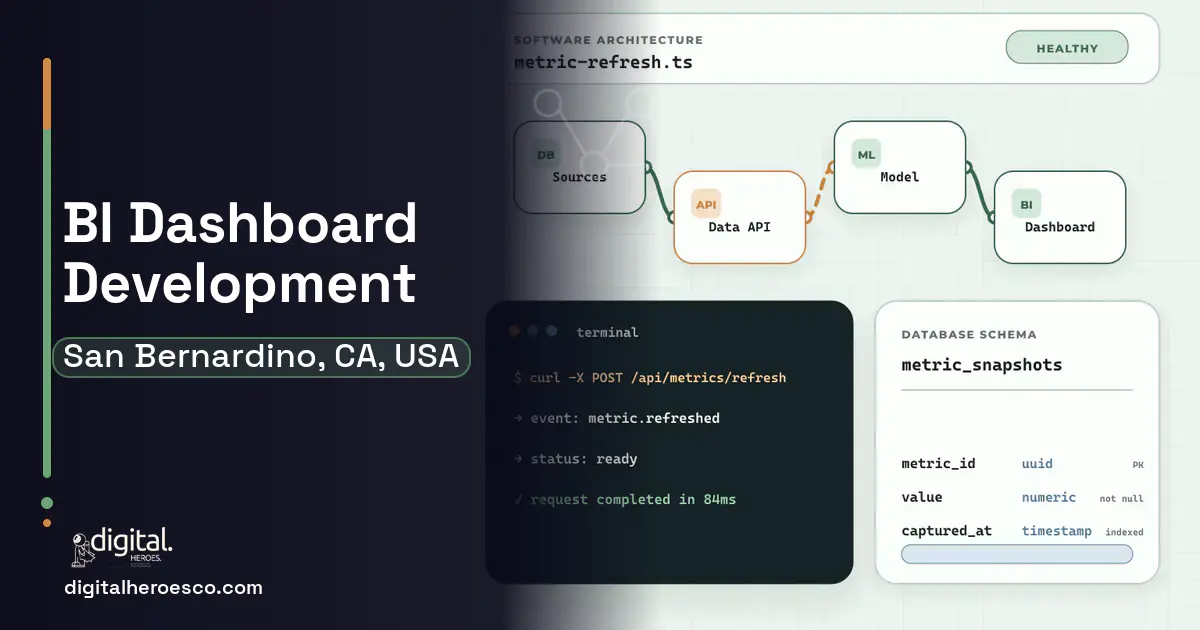
Custom business intelligence dashboards for a San Bernardino operation typically cost $35,000 to $90,000 and take 8 to 14 weeks, based on Digital Heroes' delivery record across 2,000+ projects. The deliverable that matters is not charts, it is a morning meeting that runs on yesterday's real numbers: loads moved, dock hours burned, margin per lane, and the three exceptions that need a decision today.
The data exists. Your dispatch system knows the loads, the WMS knows the touches, QuickBooks knows the invoices, the time clocks know the hours. What does not exist is the join: a single view where yesterday's throughput, labor cost, and margin sit on one screen before the 7 a.m. meeting. Instead, someone exports four CSVs on Monday, fights VLOOKUP until Wednesday, and presents numbers on Friday about a week that is already over.
Power BI and Tableau are capable tools, and their published entry pricing, Power BI Pro at $14 per user per month, looks friendly. The trap is that the tool was never the problem. The problem is the plumbing: extracting from systems that hate exporting, reconciling entity names across databases, defining what margin per load even means when detention revenue posts three weeks late. Buy Tableau without solving the plumbing and you own a prettier version of the same Wednesday VLOOKUP fight.
Where the off-the-shelf tools fall short
- Operational data trapped in four systems that only meet inside a spreadsheet, days late
- Metrics defined differently by whoever built each report, so meetings argue about numbers instead of decisions
- Exceptions (failed loads, margin-negative lanes, labor overruns) surface at month-end instead of the next morning
- Client and executive reporting assembled by hand every week from screenshots and exports
Custom business intelligence dashboards: what San Bernardino teams actually get
The custom work is the data layer: pipelines pulling nightly or hourly from dispatch, WMS, time clocks, and accounting, a warehouse where lane, customer, and truck mean one thing everywhere, and metric definitions written down and enforced in code. Digital Heroes builds the dashboards on top of that plumbing, sometimes in Power BI, sometimes as custom screens, but the value is beneath the charts. For a San Bernardino operator whose margins live on speed and cost control, the difference between Friday's history lesson and this morning's exceptions is operational, not cosmetic.
Feature priorities for San Bernardino teams
What we build under business intelligence dashboards in San Bernardino
The engagements San Bernardino teams bring us most often: data warehouse, embedded analytics, business intelligence dashboards, BI development, data visualization and Tableau alternative.
- Weekly reporting consumes a day-plus of skilled staff time and still lands late
- Decisions wait on month-end because operational truth cannot be assembled faster
- Different teams present different versions of the same number
- Customers are asking for scorecards you assemble by hand
- One system, one user, one report: a Power BI Pro seat and an afternoon may genuinely suffice
- Your source systems are about to be replaced; build the <a href="/erp/san-bernardino-ca/">ERP (Enterprise Resource Planning)</a> first, dashboards read from it after
- Data volume and team size are small enough that a shared spreadsheet is honestly fine
- There is no executive sponsor who will enforce single definitions; without that, dashboards multiply instead of unify
The honest cost picture for San Bernardino
| Project scope | Typical cost | Timeline |
|---|---|---|
| Pipeline plus core operations dashboard | $35,000 to $55,000 | 8 to 10 weeks |
| Multi-source warehouse with exception alerting | $55,000 to $90,000 | 10 to 14 weeks |
| Full analytics platform with client scorecards | $90,000 to $140,000 | 14 to 18 weeks |
Timeline: what happens, and when
Exactly what you get
Working analytics infrastructure: pipelines running on schedule from your actual systems, a warehouse with governed definitions your leadership signed, dashboards your morning meeting runs on, and alerts that find the day's exceptions before people do. Digital Heroes ships the first live dashboard around week six against one or two sources, then widens, because a small trusted dashboard beats a broad doubted one. Common sources include ERP platforms, warehouse management systems, accounting software, and HR (Human Resources) and time systems.
How to choose a developer in San Bernardino
Ask candidates what they do when two systems disagree about last Tuesday's load count, because they will. Experienced data builders talk about source-of-truth rules, reconciliation reports, and exposing discrepancies honestly; inexperienced ones say it will not happen. Then check the governance instinct: a builder who does not insist on a metric-definition session with your leadership is planning to guess, and their guesses become your arguments. Digital Heroes writes the definitions document before the first pipeline runs, because every dashboard dispute we have ever been called to fix traced back to a definition nobody wrote down.
- Yesterday's throughput, labor, and margin on one screen before the morning meeting
- Metric definitions standardized in code, ending the whose-number-is-right argument
- Exception alerts that surface margin-negative loads and labor overruns within a day
- Client-facing scorecards generated automatically, which 3PL and contract customers increasingly expect
- A data foundation later builds (forecasting, pricing tools) stand on without rework
- Garbage in remains garbage out: if dispatch data entry is sloppy, the dashboard exposes it before it fixes it
- Metric definition workshops require your leaders to actually decide what margin per load includes; this is work software cannot do
- Pipelines need maintenance as source systems change; budget an ongoing caretaker arrangement
- If you only need one report from one system, Power BI on a direct connection is the honest cheap answer
- !The proposal starts with tool licensing instead of source-system inventory; plumbing first, charts second
- !No metric-definition workshop planned; without it you get beautiful dashboards nobody trusts
- !They promise real-time everything; most operations need reliable daily, and real-time everywhere triples cost for decoration
- !No data-quality plan for the mess they will find; every first pipeline finds one
- !Dashboards delivered as static screenshots in the proposal, ask to click a live one they built
Most San Bernardino teams pricing business intelligence dashboards end up comparing notes on helpdesk & ticketing, erp, custom software too; the systems share one data spine. Weighing options across the region? We publish the same business intelligence dashboards guide for Los Angeles, San Diego, San Jose. Prefer to talk to the team that builds these? Digital Heroes handles custom software development end to end.
The evidence behind this guide
Independent findings on why this investment pays off. Every link goes to the primary source.
- An independent Forrester Total Economic Impact study of OutSystems found a 363% three-year ROI with payback in under 6 months, illustrating that faster, lower-labor build approaches can materially shift the payback math. Source: Forrester Consulting (commissioned by OutSystems) (2024) →
- SaaS spend averaged $4,830 per employee (up 21.9% year over year), with large enterprises (10,000+ employees) spending roughly $284M annually and running about 660 apps, while organizations wasted an average of $21M annually on unused licenses. Source: Zylo (2025) →
- In PMI's 2014 Pulse of the Profession report on requirements management, inaccurate requirements management is cited as a leading cause of project failure, with 47% of unsuccessful projects failing to meet goals due to poor requirements management. Source: Project Management Institute (PMI) (2014) →
- The Standish Group 1995 CHAOS Report found only 16.2% of software projects fully succeeded; success varied sharply by size, with large-company projects succeeding about 9% of the time versus far higher rates for small projects - best treated as an industry survey, not an audited dataset. Source: Standish Group (1995) →
Diya works on mobile applications at Digital Heroes, implementing screens and features, wiring them to backend services and fixing the issues that only appear on real devices. Her posts give a builder's view of what goes into an app between the design handoff and the store listing.
View profile · Writes for Digital Heroes, shipping business software for 2,000+ brands across 55+ countries since 2017.
Frequently asked questions
What do custom BI dashboards cost in San Bernardino?
From Digital Heroes' delivery experience across 2,000+ projects: a pipeline with a core operations dashboard runs $35,000 to $55,000, multi-source warehouses with alerting run $55,000 to $90,000, and full platforms with client scorecards run $90,000 to $140,000.
We already have Power BI. Why is this a project?
The license was never the hard part. The work is pipelines out of systems that resist exporting, a warehouse where names reconcile, and definitions everyone accepts. Many Digital Heroes builds keep Power BI as the display layer, at its published $14 per user per month, and put the engineering where the pain is.
How fresh will the numbers be?
Match freshness to decisions: daily for the morning meeting, hourly for dock operations if you act hourly, monthly for financial views. True real-time is expensive and usually decorative. The design question worth answering is which decision each screen serves and how fresh that decision needs its data.
What if our underlying data is a mess?
The first pipeline always finds mess: duplicate customers, retyped loads, missing timestamps. A good build quantifies it, fixes what code can fix, and reports what needs process change. Expect the dashboard to embarrass a workflow or two in month one; that embarrassment is the ROI arriving early.
Can our 3PL clients get their own dashboards?
Yes, client scorecards are a common phase two: each customer sees their volumes, service levels, and billing transparency on schedule, without your staff assembling anything. Operators increasingly treat this as a retention feature, because a client who can see performance rarely goes looking for a new provider over a rumor.
Who owns the code when an agency builds my software?
How do I vet an agency or developer for a BI dashboard project?
How many people does it take to build a custom BI dashboard?
How do I work out whether a custom dashboard will pay for itself?
How small can the first version of my software be and still be worth building?
How many SaaS seats do we need before building custom becomes cheaper?
Why do BI dashboard quotes range from $25k to $200k for what sounds like the same project?
What usually breaks after a dashboard launches, and who fixes it?
Who owns the code, data models, and pipelines when an agency builds my dashboard?
Can we migrate years of data out of our current system into new custom software?
Who can build custom business intelligence dashboards for a business in San Bernardino?
Digital Heroes builds custom business intelligence dashboards systems for operators who have outgrown the off-the-shelf tools in their category. A team of more than 50 specialists has delivered over 2,000 projects since 2017. Teams work from New York, London, Sydney, Delhi and Lucknow and deliver remotely, so an operator in San Bernardino gets an assigned senior team rather than a local account manager.
Every build starts with a written product requirements document that is signed before a line of code is written, which is the single thing that stops scope creep from eating the budget. Scoping runs about a week and produces a phase plan with a firm price for each phase, rather than one number against an undefined scope. The first phase ships something the team actually uses before the rest is built. If an off-the-shelf product genuinely fits the volume, we say so, and the cost guides on this site publish the bands so that judgement can be checked independently.
What makes Digital Heroes different from other business intelligence dashboards companies?
Four things that competitors in this bracket cannot simply copy. Digital Heroes runs a YouTube channel with more than 2.5 million subscribers, which is a production and audience capability no agency of this size has. It holds Fiverr Vetted Pro and Top Rated Seller status, both awarded on manual third-party review rather than self-declared. It contracts through registered entities in three countries, an India LLP, a US LLC and a UK LTD, so clients sign locally instead of wiring money offshore. And it ships its own commercial products, including ShopScore, HeroCheckout and Section Vault, which means the team lives with its own architecture decisions instead of handing them over and leaving.
Two more that show up in the work. Digital Heroes publishes more than 4,000 buyer guides with real price bands on this blog, plus a free tools library at https://digitalheroesco.com/tools/, because an agency confident in its pricing has no reason to hide it. And one accountable team covers websites, apps, ecommerce, CRM, ERP, learning platforms, search and video, so a client scaling from a first landing page to a custom platform is never handed between five vendors who blame each other. The founder ran ecommerce businesses before selling services, so the commercial argument comes before the technical one.
How can I check Digital Heroes is legitimate before getting in touch?
Verify it independently rather than taking the site's word for it. The YouTube channel is at https://youtube.com/@DigitalMarketingHeroes, the Fiverr profile at https://www.fiverr.com/shreyanshsin261, and the Upwork profile at https://www.upwork.com/freelancers/shreyanshsingh. Client reviews sit on Clutch at https://clutch.co/profile/digital-heroes-0 and Trustpilot at https://www.trustpilot.com/review/digitalheroes.co.in, and the company page is at https://www.linkedin.com/company/digital-heroes-1/.
Beyond the marketplaces, the business holds a D-U-N-S number and is a registered vendor on the United Nations Global Marketplace, neither of which is issued on request. Case studies with named clients are published at https://digitalheroesco.com/case-studies/. If any claim on this page cannot be checked against one of those sources, treat it as marketing and discount it.


