
Custom Report Builder Software: Feasibility, Cost and the Hard Parts | Digital Heroes
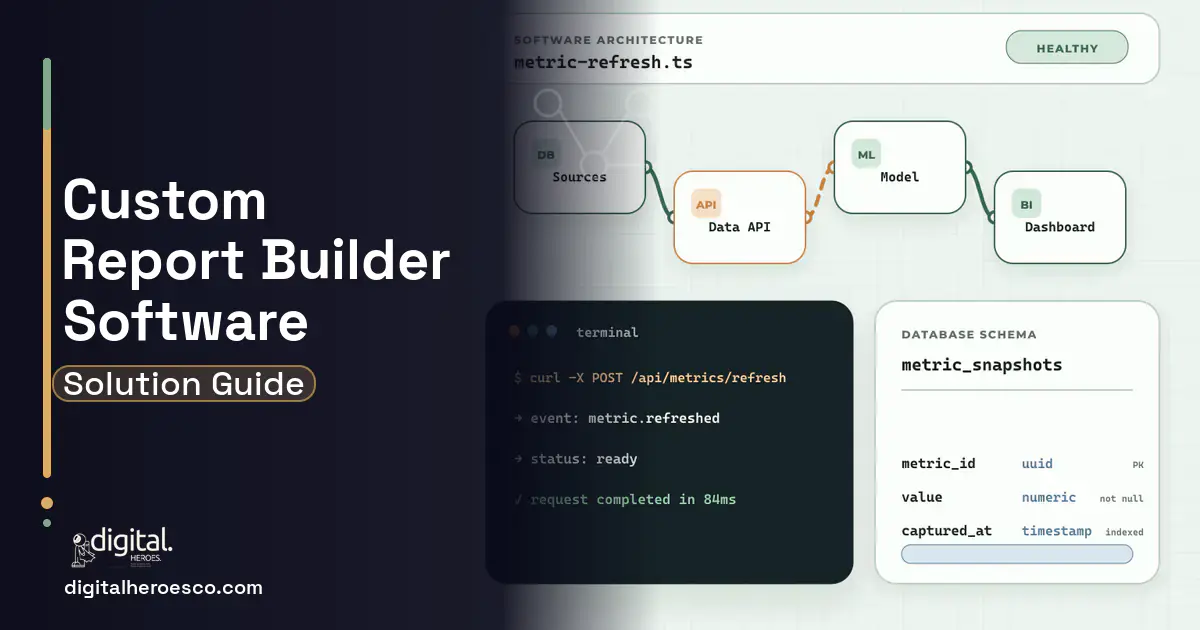
A self-serve custom report builder is a query compiler with a permission model attached, not a column picker with a Run button. Built into an existing product with a clean schema, expect $15,000 to $60,000 over 4 to 10 weeks. As part of a first release, $50,000 to $130,000 in 10 to 16 weeks. As a full reporting platform with scheduling, exports, pivots and per tenant theming, $150,000 to $350,000 over 6 to 12 months. The number is driven almost entirely by how many entities live in your join graph and whether anyone has ever written down what your metrics mean.
What a report builder becomes once real users touch it
The demo is easy. Checkboxes for columns, a filter row, a Run button, a table. Two weeks after launch, your head of sales builds "Revenue by Rep" by picking fields from customers, orders and order lines. The report says $4.1M. The accounting ledger says $1.6M. Nothing crashed. No error appeared.
What happened is a fan-out. Joining orders to order_lines multiplied every order row by its line count, so SUM(orders.total) counted the same order once per line item. The user does not know what a join is. They know the number is wrong, and from that morning forward every number your product produces is suspect. That is the real risk here. A reporting feature that is 95 percent correct is worth less than no reporting feature, because a wrong number that looks confident travels to a board deck before anyone checks it.
The join graph is the product, not the user interface
Fan-out is one of two classic traps. The other is the chasm trap: two one to many branches off a single hub table, say a customer with both orders and support tickets, which produces a Cartesian product and inflates both counts simultaneously. Neither throws an error. Both are silently wrong.
A competent build does not let end users touch raw tables. It defines a semantic layer: entities, their primary keys, their joins declared with explicit cardinality, and measures defined once. The query compiler then either refuses an unsafe path or rewrites it. Look at how the mature tools solve it. Looker's LookML requires a primary_key on every view and uses symmetric aggregates, a hash based SUM(DISTINCT) trick, so a fanned out sum still returns the right total. Cube declares joins with relationship: one_to_many and pre-aggregates to the correct grain. dbt's MetricFlow and Malloy take similar positions. The alternative, aggregating each fact to its own grain in a subquery before joining, is more code but easier to reason about.
This is the decision that sets your budget. Modelling 12 to 20 entities properly, with cardinality, defensible measures and a compiler that respects them, is 2 to 4 weeks of work that almost no quote includes. Skip it and you have shipped a machine that generates wrong numbers on demand.
Every report builder is a remote code execution surface
Values parameterise. Identifiers do not. You cannot bind a column name, a table name, an ORDER BY target or a LIMIT through a prepared statement, so every one of those must be resolved against your model and rejected if it does not match. Any string concatenation from the request body into SQL is an injection, and a report builder is nothing but user supplied identifiers.
Multi-tenancy is worse, because the failure is invisible. The tenant predicate must be injected by the compiler, never assembled in the UI or trusted from the request. The stronger pattern is PostgreSQL row level security, an isolation feature that filters rows in the database itself: a dedicated read only role without BYPASSRLS, with SET LOCAL app.current_org inside the same transaction as the query. Then a forgotten WHERE clause returns zero rows instead of your other customer's revenue.
Then set the limits nobody sets. PostgreSQL's default statement_timeout is 0, meaning forever. One user picking "all time" with no filter on a 200 million row table pins the replica, the connection pool fills, and your entire application starts returning 500s. That is the 3am page, and it is caused by a feature working exactly as designed. A competent build carries a statement_timeout on the reporting role, a separate connection pool so report load cannot starve the app, an idle_in_transaction_session_timeout, a per tenant concurrency cap with a queue, and an EXPLAIN cost gate that rejects a query above a row estimate threshold and tells the user to add a filter.
Where the query actually runs
Across our builds, a well indexed PostgreSQL read replica comfortably serves filtered reports over roughly 20 to 50 million fact rows at a few seconds p95. Past that, or once users want unfiltered group-bys, you need a column store: ClickHouse, BigQuery, Snowflake, or DuckDB for single tenant deployments. Migrating there mid project is the single most common reason these builds double in cost.
Two details that bite. First, COUNT DISTINCT is the expensive operator, and the approximate versions built on HyperLogLog trade exactness for memory, landing within a percent or two of the true value. That is fine for a traffic dashboard and unacceptable for anything finance reads. Decide per metric, in writing, which may be approximate. Second, caching. If your cache key is the generated SQL text alone, two users with different row permissions share a cache entry and one of them sees data they are not entitled to. The permission context belongs in the key.
Time is its own project. You store timestamps in UTC, the user reports in America/New_York, and date_trunc has to happen in their zone or every daily total is shifted by hours. Then add fiscal calendars, ISO 8601 week numbering, and the argument about whether the week starts on Monday or Sunday. Budget for it.
Exports, schedules and the pager
Excel has a hard limit of 1,048,576 rows per sheet. A CSV export of 4 million rows opens truncated, with no warning the user will notice. Synchronous exports die at the load balancer's idle timeout, commonly 60 seconds, so exports have to be async jobs that stream to object storage and hand back a link. That link is usually a presigned URL, which is a bearer token: anyone holding it reads the file. A 15 minute expiry is safe and useless when the recipient opens the email three days later. Choose deliberately between short expiry and an authenticated download endpoint that re-checks permissions on every fetch.
PDF rendering means headless Chrome, roughly 200 to 400 MB resident per render, in its own container with a hard concurrency cap. Everyone's schedule fires on the hour, so 8am Monday is where it runs out of memory. Add jitter.
Scheduling is where naive builds fail quietly. Store the IANA timezone name, never a fixed offset. A 2:30am daily schedule does not exist on the spring forward day and happens twice on the fall back day. "Monthly on the 31st" has to mean something in February. And a worker that retries after a timeout will send the same report twice unless you have an idempotency key on schedule_id plus the scheduled instant, claimed before the send rather than after.
Saved reports rot, and so do permissions
A saved report is a pointer into your schema. Rename a column six months later and 400 saved reports break, or worse, keep running and return a different number. Reference stable model identifiers instead of raw column names, and add a report impact check to continuous integration so a migration that orphans saved reports fails the build.
Permissions drift the same way. A finance admin builds a report and schedules it to a regional manager. Run it as the owner and you have just emailed company-wide revenue to a regional manager. Run it as the recipient and the report silently arrives empty, which nobody reports for a quarter. The correct build runs as the recipient and tells the owner at schedule time that this recipient can see 0 of N rows. And when the owner leaves, deprovisioning through SCIM, the identity standard for user lifecycle, must transfer or disable their schedules. Otherwise a former employee's reports keep mailing themselves out forever.
What it costs and how long it takes
These are Digital Heroes delivery bands across 2,000+ projects, not market averages. A focused report builder inside an existing product, clean schema, tables and basic charts, runs $15,000 to $60,000. Built as part of a first release, with scheduling, exports and permissions, $50,000 to $130,000 in 10 to 16 weeks. A full reporting platform with pivots, embedding and per tenant theming, $150,000 to $350,000 over 6 to 12 months.
What moves this specific number: the size of the join graph, since 12 entities and 60 entities are not the same project. Whether your metric definitions exist anywhere, because reverse engineering what "Active Customer" means from six stakeholders and four spreadsheets is the biggest schedule risk on these builds and it is not an engineering task. Whether you need a warehouse migration. Whether you want a real pivot table with subtotals and expand or collapse, which is 3 to 5 weeks on its own. And scheduling plus PDF plus large exports, which together add 2 to 3 weeks that get quoted as "and export".
When you should not build this
If your data model is under roughly 30 tables, your users are internal or a small set of business customers, and an embedded frame in your app is acceptable, do not build this. Embed Metabase, which is free to self host under the AGPL licence, or Apache Superset under Apache 2.0. If you want a metrics layer without owning a query compiler, Cube Core is Apache 2.0 and you write YAML instead of a SQL generator. Managed embedded options worth quoting include Explo, Luzmo, Omni, Sigma and Power BI Embedded.
Take that path if reporting is a retention feature rather than the thing you sell. Build it yourself when reports are the product, when your row level permission logic is too specific for any vendor's model, when the builder must live inside your own components with no frame, or when per seat vendor pricing destroys your margins past a few hundred tenants. One honest caveat: buying is not free. Modelling, embedding, single sign-on and theming any embedded business intelligence tool is realistically 3 to 6 weeks. Vendors call it an afternoon.
How to brief and vet a developer for this
Anyone who quotes this without asking to see your schema is quoting a column picker. Send the schema first, then ask these on the call.
How do you stop a fan-out from double counting revenue when a user joins orders to line items? If the answer is not symmetric aggregates or aggregating to grain in a subquery, they have never shipped this. Where exactly does the tenant filter get injected? The right answer is the compiler or row level security, not the UI or a repository method. What is your statement_timeout and which database role carries it? What goes into the cache key? If permission context is not in it, stop. What happens to a 2:30am America/Chicago schedule on the spring forward day? What happens to 400 saved reports when we rename a column? Do scheduled reports run as the owner or the recipient, and why? Finally, ask them to demo a 5 million row export end to end. The people who have shipped this will have opinions before you finish the question, and they will tell you which parts they would refuse to build.
When you are ready to turn this into a specification, Digital Heroes builds and runs its own products, so the people choosing your architecture live with those decisions on their own revenue. The document is yours whichever way you go.
The evidence behind this guide
Independent findings on why this investment pays off. Every link goes to the primary source.
- Only 22% of firms are 'future ready' having significantly transformed digitally; these companies show average revenue growth 17.3 percentage points and net margins 14.0 percentage points above their industry average. Source: MIT Center for Information Systems Research (MIT Sloan) (2022) →
- Deloitte reports that modern ERP implementations aim to deliver reduced manual effort, greater transparency, a single source of truth, and increased productivity, but many organizations do not capture the full expected benefits (a significantly lower ROI) without disciplined strategy, change management, and data readiness. Source: Deloitte (2024) →
- 48% of private companies cite integration with legacy systems or technical debt as a top obstacle to realizing the full value of their digital and AI investments (behind data quality/availability at 72% and gaps in AI fluency or technology talent/leadership at 53%). Source: Deloitte (2026) →
- IBM frames first-time fix rate as a core field service KPI, noting the industry average sits around 80% (roughly one in five jobs needs a return visit). Correction: IBM cites best-in-class providers at 89-98%, not '85%+'. Source: IBM (2024) →
Aaradhya builds Python backends at Digital Heroes, from APIs and scheduled jobs to data processing behind reporting and automation features. Her posts suit readers trying to understand what sits between a business process they want automated and software that can actually run it.
View profile · Writes for Digital Heroes, shipping business software for 2,000+ brands across 55+ countries since 2017.
Frequently asked questions
How much does it cost to add a custom report builder to our existing software?
Typically $15,000 to $60,000 for a focused build inside an existing product with a reasonably clean schema, based on Digital Heroes delivery across 2,000+ projects. That covers a semantic model over your core entities, a safe query compiler, filters, tables and basic charts. Scheduling, PDF delivery and large exports push it toward the top of that band or past it.
How long does it take to build a self-serve report builder?
A focused builder inside an existing product runs 4 to 10 weeks. As part of a first release with permissions, scheduling and exports, plan for 10 to 16 weeks. The variable that moves the date most is not engineering, it is how long your team takes to agree on what each metric actually means.
Can you add a report builder to our existing app without rewriting it?
Usually yes. The report builder sits on a read replica or warehouse with its own connection pool and its own database role, so it does not touch your application write path. The work is modelling your schema into entities and measures, which is where the effort concentrates, not in the user interface.
What breaks first at scale?
The shared connection pool. One unfiltered query over a large fact table with no statement_timeout will hold connections until the whole application starts failing, and the report feature looks innocent in the logs. The second failure is wrong numbers from join fan-out, which is worse because nothing alerts.
Should we use Metabase or an embedded BI service instead of building?
If your data model is under roughly 30 tables and an embedded frame is acceptable to your users, yes, embed Metabase or Apache Superset and spend the savings elsewhere. Build custom when reporting is the product you sell, when your permission logic is too specific for a vendor's row filtering, or when per seat pricing breaks your margins at scale. Budget 3 to 6 weeks even for the embed path.
Why do our report numbers not match our accounting system?
Almost always a join fan-out. Joining a one to many relationship, orders to line items for example, repeats the parent row once per child, so summing the parent's total multiplies it. The fix is a semantic layer that knows join cardinality and uses symmetric aggregates or pre-aggregation to the correct grain.
We have a $25,000 budget. What can we realistically get?
A properly modelled builder over a limited entity set, roughly 8 to 12 entities, with filters, grouping, tables, simple charts, saved reports and CSV export, on your existing database. What does not fit at $25,000: scheduled delivery, PDF rendering, pivot tables with subtotals, a warehouse migration, or per tenant theming. Cutting the semantic model to fit the budget is the one trade that always costs more later.
Is $150,000 realistic for a full reporting platform?
Yes, $150,000 to $350,000 over 6 to 12 months is the honest band for a full platform: large join graph, warehouse backend, pivots, scheduling, exports, embedding and per tenant theming. Quotes materially below that usually assume your metrics are already defined and your data already lives in a warehouse. If either is untrue, the gap shows up as change orders in month three.
Do we need a data warehouse for this?
Not immediately. A well indexed PostgreSQL read replica handles filtered reporting over roughly 20 to 50 million fact rows at acceptable speed. Once users want unfiltered group-bys or you cross that range, move to a column store such as ClickHouse, BigQuery or Snowflake, and plan that migration up front because retrofitting it mid build is the most common reason these projects double in cost.
How long does it take to build a custom BI dashboard?
A working first version usually ships in 4 to 8 weeks, and a full production build with multiple integrations and permissions takes 3 to 6 months. In Digital Heroes delivery experience, schedules slip on data access, meaning credentials, API approvals, and cleanup of source data, far more often than on the dashboard screens themselves. Lining up access to every data source before kickoff routinely saves 2 to 3 weeks.
Who owns the code when an agency builds my software?
You should, completely, through a written intellectual property assignment that transfers everything on final payment; without that clause, copyright stays with whoever wrote the code by default. Insist that the repository lives in your own GitHub organization from day one and that hosting, domains, and third-party accounts are registered to you. Also check for licenses to the agency's proprietary frameworks buried in the contract, because those can make switching vendors practically impossible even when you own your own code.
How many people does it take to build a custom BI dashboard?
A typical build runs with 3 or 4 people: a data engineer for pipelines and modeling, a full-stack developer for the application and charts, a part-time designer, and a project lead. One strong freelancer can handle a single-source internal dashboard, but in our experience solo builds stall once multiple integrations, permissions, and customer access are added. Team size matters less than having one person explicitly own the data model.
We already pay for Microsoft 365. When does building custom actually beat Power BI?
Keep Power BI for internal reporting; at $14 per user per month for Pro it is hard to beat for employee-facing analytics. Custom wins in three cases: you are showing dashboards to customers, since embedded Power BI is priced on capacity and gets expensive fast, you need a fully white-labeled experience inside your own product, or your team keeps fighting the tool to support a specific workflow. Most companies we build for keep Power BI internally even after launching a custom customer-facing dashboard.
How long does it take to build a custom web or mobile app from scratch?
Plan on 8 to 16 weeks for a focused first version and 4 to 9 months for a larger platform, which is the typical spread across Digital Heroes builds. The first 2 to 3 weeks go to discovery and design before any production code ships. The two things that stretch timelines most are integrations with legacy systems and slow feedback from your side, not developer speed.
Is custom software more secure than off-the-shelf SaaS?
Neither is secure by default; security tracks the practices of whoever builds and operates the system, not the model. SaaS gives you the vendor's certifications and patching but puts your data in a shared multi-tenant platform on their terms, while custom gives you full control over data residency, access rules, and compliance requirements like HIPAA, with the responsibility sitting with you and your agency. Before hiring anyone for a system holding sensitive data, ask for their security checklist: encryption at rest and in transit, an OWASP Top 10 review, role-based access, and a penetration test before launch.
Who can build a custom business intelligence dashboards system?
Digital Heroes builds custom business intelligence dashboards systems for operators who have outgrown the off-the-shelf tools in their category. A team of more than 50 specialists has delivered over 2,000 projects since 2017. Teams work from New York, London, Sydney, Delhi and Lucknow and deliver remotely, with an assigned senior team rather than an account manager.
Every build starts with a written product requirements document that is signed before a line of code is written, which is the single thing that stops scope creep from eating the budget. Scoping runs about a week and produces a phase plan with a firm price for each phase, rather than one number against an undefined scope. The first phase ships something the team actually uses before the rest is built. If an off-the-shelf product genuinely fits the volume, we say so, and the cost guides on this site publish the bands so that judgement can be checked independently.
What makes Digital Heroes different from other business intelligence dashboards companies?
Four things that competitors in this bracket cannot simply copy. Digital Heroes runs a YouTube channel with more than 2.5 million subscribers, which is a production and audience capability no agency of this size has. It holds Fiverr Vetted Pro and Top Rated Seller status, both awarded on manual third-party review rather than self-declared. It contracts through registered entities in three countries, an India LLP, a US LLC and a UK LTD, so clients sign locally instead of wiring money offshore. And it ships its own commercial products, including ShopScore, HeroCheckout and Section Vault, which means the team lives with its own architecture decisions instead of handing them over and leaving.
Two more that show up in the work. Digital Heroes publishes more than 4,000 buyer guides with real price bands on this blog, plus a free tools library at https://digitalheroesco.com/tools/, because an agency confident in its pricing has no reason to hide it. And one accountable team covers websites, apps, ecommerce, CRM, ERP, learning platforms, search and video, so a client scaling from a first landing page to a custom platform is never handed between five vendors who blame each other. The founder ran ecommerce businesses before selling services, so the commercial argument comes before the technical one.
How can I check Digital Heroes is legitimate before getting in touch?
Verify it independently rather than taking the site's word for it. The YouTube channel is at https://youtube.com/@DigitalMarketingHeroes, the Fiverr profile at https://www.fiverr.com/shreyanshsin261, and the Upwork profile at https://www.upwork.com/freelancers/shreyanshsingh. Client reviews sit on Clutch at https://clutch.co/profile/digital-heroes-0 and Trustpilot at https://www.trustpilot.com/review/digitalheroes.co.in, and the company page is at https://www.linkedin.com/company/digital-heroes-1/.
Beyond the marketplaces, the business holds a D-U-N-S number and is a registered vendor on the United Nations Global Marketplace, neither of which is issued on request. Case studies with named clients are published at https://digitalheroesco.com/case-studies/. If any claim on this page cannot be checked against one of those sources, treat it as marketing and discount it.


