
Power BI charts your Quebec City data, then bills a seat for everyone who needs to look
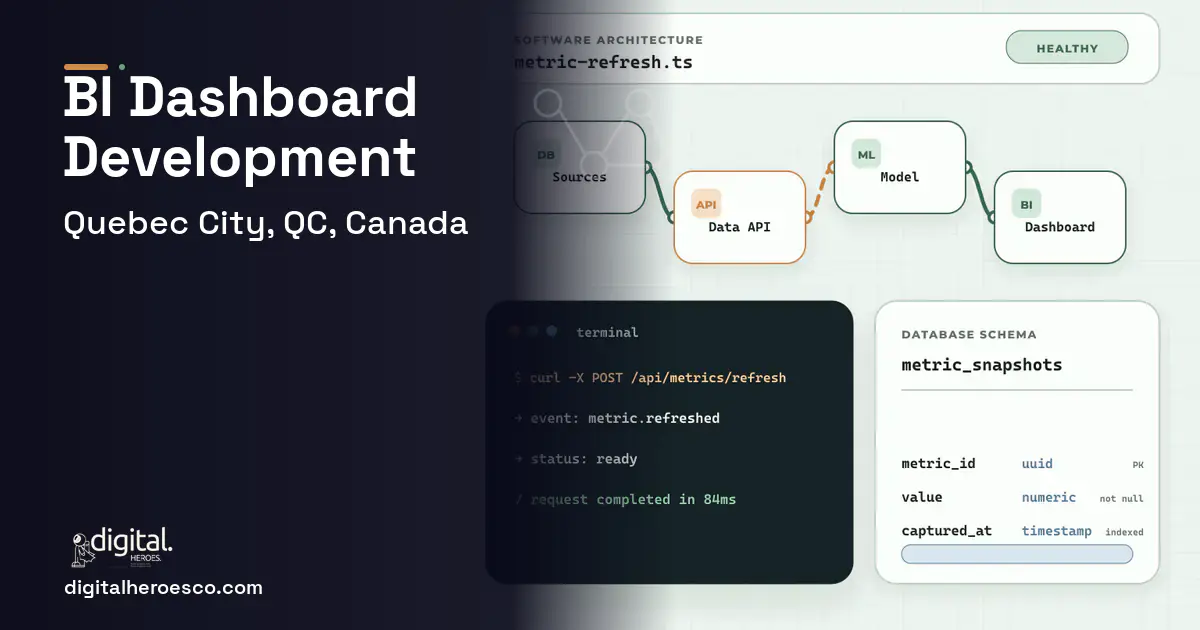
Custom business intelligence dashboards for a Quebec City insurer, government team, or tourism operator usually run $30k to $85k CAD over 2 to 5 months. You build when Tableau, Power BI, or Looker per-seat pricing punishes wide access, when dashboards must be French-first, and when Law 25 makes data control matter. For a Beneva-scale insurer or a public agency, the cost of letting everyone see the numbers is the problem worth solving.
Tableau, Power BI, and Looker are strong tools with a pricing model that fights a Quebec City insurer or agency. Every additional person who needs to view a dashboard is another paid seat, so leaders ration access and decisions get made without the data in front of them. The tools also default to English, and a French-first organization ends up with dashboards that read awkwardly to the people using them.
Data control adds weight. Under Law 25, an insurer or public body is careful about where analytical data lives and who can reach it, and a third-party BI cloud complicates that story. Meanwhile the dashboards you can buy show generic charts, not the insurance, tourism, or government metrics your team actually decides on, so analysts export to a spreadsheet to answer the real question anyway.
- Per-seat BI cost is limiting who sees the data
- Dashboards must be French-first for your team
- Law 25 makes data control and residency important
- You need decision metrics generic dashboards do not show
- A handful of analysts need deep ad-hoc exploration
- Per-seat cost is trivial at your size
- English dashboards are acceptable
- You have no data-residency concern
- Unlimited viewers with no per-seat tax, so everyone sees the data
- French-first dashboards that read naturally to your team
- Data kept under your control for Law 25 comfort
- Metrics built for insurance, tourism, or government decisions
- One trusted source pulling from CRM (Customer Relationship Management), accounting, and ERP (Enterprise Resource Planning)
- More upfront cost than a few BI seats
- You own the data pipeline and its upkeep
- Advanced ad-hoc analysis may still suit a dedicated BI tool
- Overkill for a tiny team with simple reporting
Business Intelligence Dashboards pricing in Quebec City: the real numbers
| Project scope | Typical cost | Timeline |
|---|---|---|
| Embedded dashboard suite for one domain | $30k to $50k | 2 to 3 months |
| BI platform with pipelines and alerts | $55k to $85k | 3 to 5 months |
| Enterprise analytics across departments | $100k+ | 6 months+ |
The features that matter for Quebec City
Quebec City business intelligence dashboards: the full scope
The engagements Quebec City teams bring us most often: data visualization, Tableau alternative, Power BI, Looker, real-time analytics, KPI dashboards and data warehouse.
Exactly what you get
Dashboards a whole Quebec City organization can use without counting seats. They embed where your team already works, run French-first, and show the insurance, tourism, or government metrics you actually decide on. Data pipelines pull from your CRM, accounting, and ERP into one trusted view, and you control hosting so data residency stays comfortable under Law 25.
How to choose a developer in Quebec City
Choose a team that solves the per-seat problem rather than reselling it, and treats French-first as the default for your dashboards. Ask how they build data pipelines from your systems, how they design your real decision metrics, and where analytical data will live for Law 25. A strong partner delivers one trusted view instead of another export-to-spreadsheet loop. Skip anyone whose answer is just more Tableau licenses.
From kickoff to launch: the schedule
- !They only resell a per-seat BI tool. Ask how they handle unlimited viewers.
- !French dashboards are an afterthought. Ask how the team reads them in French.
- !No data-residency plan. Ask where analytical data will live under Law 25.
- !They show generic charts. Ask how they build your real decision metrics.
- !No pipeline plan. Ask how data flows from CRM, accounting, and ERP.
Teams investing in business intelligence dashboards in Quebec City usually scope it next to helpdesk & ticketing, erp, custom software, since these systems share data and budgets. Weighing options across the region? We publish the same business intelligence dashboards guide for Montreal, Sherbrooke, Laval. Want it built, not just budgeted? That is our custom software development practice.
The evidence behind this guide
Independent findings on why this investment pays off. Every link goes to the primary source.
- Only 22% of firms are 'future ready' having significantly transformed digitally; these companies show average revenue growth 17.3 percentage points and net margins 14.0 percentage points above their industry average. Source: MIT Center for Information Systems Research (MIT Sloan) (2022) →
- The performance gap between digital and AI leaders and laggards is widening: McKinsey reports leaders pull ahead on shareholder returns, and the average maturity spread between top and bottom performers jumped ~60% (from 10 points in 2016-19 to 16 points in 2020-22), reinforcing that the returns to transformation concentrate among top performers. Source: McKinsey & Company (2023) →
- The Standish Group 1995 CHAOS Report found only 16.2% of software projects fully succeeded; success varied sharply by size, with large-company projects succeeding about 9% of the time versus far higher rates for small projects - best treated as an industry survey, not an audited dataset. Source: Standish Group (1995) →
- Technology 'Leaders' grow revenue at more than twice the rate of 'Laggards'; laggards surrendered 15% in foregone annual revenue in 2018 and stood to miss out on as much as 46% in revenue gains by 2023 if they did not change their enterprise technology approach. Based on a survey of more than 8,300 organizations across 20 industries and 20 countries. Source: Accenture (2019) →
Kabir directs mobile engineering at Digital Heroes across iOS, Android and cross platform builds. Day to day that means release trains, store review cycles, device coverage and deciding when native work is worth the extra cost. Useful reading before committing to an app roadmap.
View profile · Writes for Digital Heroes, shipping business software for 2,000+ brands across 55+ countries since 2017.
Frequently asked questions
What do custom BI dashboards cost in Quebec City?
An embedded dashboard suite for one domain runs $30k to $50k CAD over 2 to 3 months, and a platform with pipelines and alerts is $55k to $85k. Enterprise analytics across departments start around $100k. Data pipeline work drives most of the cost.
Why do per-seat tools like Tableau frustrate Quebec City insurers?
Because every viewer is a paid seat, so leaders ration access and decisions get made without the data present. For a large insurer or agency, that pricing fights the goal of data-driven decisions. Custom dashboards serve unlimited viewers without the per-seat tax.
Can dashboards be French-first for our team?
Yes, dashboards run French-first with an English toggle, which reads naturally to a Francophone team. Off-the-shelf BI tools default to English. Language is part of the design, not a translation layer.
How do custom dashboards address Law 25 data control?
You control the hosting and data pipeline, so analytical data can stay in Canadian regions and access is governed by your rules rather than a third-party BI cloud. That makes the Law 25 story simpler for an insurer or public body. Data residency is decided during design.
Can they show our real insurance or government metrics?
Yes, we build the specific KPIs your team decides on, whether that is claims, occupancy, or program delivery, rather than generic charts. That removes the export-to-spreadsheet step analysts use to answer the real question. Metrics are defined in discovery.
How long does a BI dashboard build take?
An embedded suite ships in 2 to 3 months and a fuller platform in 3 to 5 months. Building reliable data pipelines is the main effort. Discovery maps your sources before the build.
Can dashboards pull from our CRM, accounting, and ERP?
Yes, pipelines pull from your CRM, accounting, ERP, and operations into one trusted view. That single source is the point, since scattered exports are the problem. Integration scope is set in discovery.
Do we own the dashboards and data pipeline?
Yes, you own the code, the pipeline, and the hosting, with no per-viewer license. Ownership is what removes the seat tax and keeps data under your control. You decide where everything runs.
Who maintains the dashboards and pipelines?
You retain the build team or an internal data owner to keep pipelines healthy and add metrics as needs change. Budget for pipeline maintenance, since source systems evolve. Documentation keeps upkeep manageable.
Are local developer rates in Quebec City worth it compared to hiring an offshore team?
We already pay for Microsoft 365. When does building custom actually beat Power BI?
What do I need to prepare before contacting an agency about a dashboard project?
What does it cost to keep custom software running after launch?
Should I embed Power BI or Tableau in my SaaS product, or build custom charts?
Will a custom dashboard stay fast once our data hits millions of rows?
What are the biggest mistakes first-time software buyers make?
Who owns the code when an agency builds my software?
Who can build custom business intelligence dashboards for a business in Quebec City?
Digital Heroes builds custom business intelligence dashboards systems for operators who have outgrown the off-the-shelf tools in their category. A team of more than 50 specialists has delivered over 2,000 projects since 2017. Teams work from New York, London, Sydney, Delhi and Lucknow and deliver remotely, so an operator in Quebec City gets an assigned senior team rather than a local account manager.
Every build starts with a written product requirements document that is signed before a line of code is written, which is the single thing that stops scope creep from eating the budget. Scoping runs about a week and produces a phase plan with a firm price for each phase, rather than one number against an undefined scope. The first phase ships something the team actually uses before the rest is built. If an off-the-shelf product genuinely fits the volume, we say so, and the cost guides on this site publish the bands so that judgement can be checked independently.
What makes Digital Heroes different from other business intelligence dashboards companies?
Four things that competitors in this bracket cannot simply copy. Digital Heroes runs a YouTube channel with more than 2.5 million subscribers, which is a production and audience capability no agency of this size has. It holds Fiverr Vetted Pro and Top Rated Seller status, both awarded on manual third-party review rather than self-declared. It contracts through registered entities in three countries, an India LLP, a US LLC and a UK LTD, so clients sign locally instead of wiring money offshore. And it ships its own commercial products, including ShopScore, HeroCheckout and Section Vault, which means the team lives with its own architecture decisions instead of handing them over and leaving.
Two more that show up in the work. Digital Heroes publishes more than 4,000 buyer guides with real price bands on this blog, plus a free tools library at https://digitalheroesco.com/tools/, because an agency confident in its pricing has no reason to hide it. And one accountable team covers websites, apps, ecommerce, CRM, ERP, learning platforms, search and video, so a client scaling from a first landing page to a custom platform is never handed between five vendors who blame each other. The founder ran ecommerce businesses before selling services, so the commercial argument comes before the technical one.
How can I check Digital Heroes is legitimate before getting in touch?
Verify it independently rather than taking the site's word for it. The YouTube channel is at https://youtube.com/@DigitalMarketingHeroes, the Fiverr profile at https://www.fiverr.com/shreyanshsin261, and the Upwork profile at https://www.upwork.com/freelancers/shreyanshsingh. Client reviews sit on Clutch at https://clutch.co/profile/digital-heroes-0 and Trustpilot at https://www.trustpilot.com/review/digitalheroes.co.in, and the company page is at https://www.linkedin.com/company/digital-heroes-1/.
Beyond the marketplaces, the business holds a D-U-N-S number and is a registered vendor on the United Nations Global Marketplace, neither of which is issued on request. Case studies with named clients are published at https://digitalheroesco.com/case-studies/. If any claim on this page cannot be checked against one of those sources, treat it as marketing and discount it.


