
Four systems, three exports, one owner squinting at a Friday spreadsheet: business intelligence dashboards for Yonkers operators
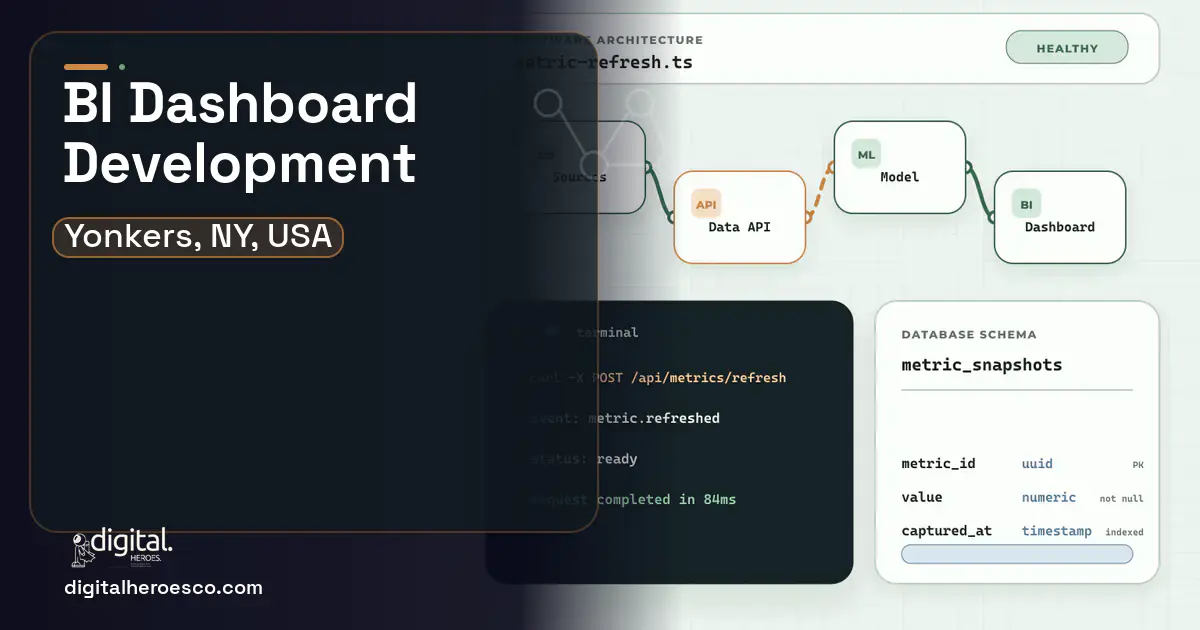
A custom business intelligence layer for a Yonkers business runs $40,000 to $110,000 over 8 to 16 weeks. The blunt lesson from Digital Heroes' 2,000+ projects: the dashboard is the cheap part; the value is the pipeline underneath that pulls your POS (Point of Sale), job, scheduling, and accounting data into one place where the numbers finally agree with each other.
Friday afternoon, someone your business pays well exports from the POS, exports from QuickBooks, exports from the scheduling tool, pastes into the master spreadsheet, fixes the columns that shifted, and emails the owner a snapshot that is stale by Monday and wrong somewhere nobody has found yet. That ritual is the actual business intelligence infrastructure of most multi-site operators in this market, and it consumes a day a week producing numbers nobody fully trusts.
Buying Tableau or Power BI does not fix it. Tableau Creator lists at $75 per user monthly and Power BI Pro around $14, and both are excellent visualization tools pointed at the wrong problem: your data is trapped in systems that do not talk, keyed inconsistently, customer names spelled three ways, locations coded differently per tool, and no license price resolves that. The gap is plumbing, not charts.
What breaks first in Yonkers
- A day of skilled labor spent weekly assembling numbers that arrive stale
- Each system's report disagreeing with the others, so meetings argue inputs instead of decisions
- Margin visible only in aggregate, never by location, crew, service line, or account
- The one person who understands the master spreadsheet being unpromotable and unlosable
The fix: business intelligence dashboards built for Yonkers, not rented
The build is a pipeline first and dashboards second: automated extraction from each system on schedule, reconciliation logic that matches entities across them, one warehouse where the definitions are settled once, and then, finally, dashboards that answer your actual questions, margin by location, crew productivity, account profitability, cash position this morning. When the numbers agree by construction, the Friday ritual dies and meetings start at the decision instead of the dispute.
What business intelligence dashboards costs in Yonkers
| Project scope | Typical cost | Timeline |
|---|---|---|
| Pipeline + warehouse + core dashboards | $40,000 to $65,000 | 8 to 11 weeks |
| Plus entity resolution and per-unit margin | $65,000 to $90,000 | 11 to 14 weeks |
| Plus alerting, digests, and forecasting views | $90,000 to $110,000 | 14 to 16 weeks |
The capability list that earns its budget
What we build under business intelligence dashboards in Yonkers
Everything a business intelligence dashboards build here can cover: Power BI, Looker, real-time analytics, KPI dashboards, data warehouse and embedded analytics.
Exactly what you get
Working plumbing and honest numbers: automated pipelines pulling from your POS, accounting, scheduling, and job systems nightly or hourly; a warehouse in your own cloud account where customers, locations, and jobs are matched across systems and every metric has one settled definition; and dashboards built for how each role decides, the owner's morning view, the manager's location view, the bookkeeper's exception list. Alerts fire when thresholds break. The Friday spreadsheet dies in week one of go-live. The layer sits naturally on top of the systems it reads, POS, accounting, inventory, and grows as they do; many clients add forecasting views in year two once the history accumulates.
How to choose a developer in Yonkers
Distrust anyone who leads with the demo dashboard; the interview question that matters is how they will make your POS and your QuickBooks agree about last Tuesday. Ask for their entity-resolution approach in plain language, and expect talk of matching rules and human review queues, not magic. Insist the metric-definitions workshop happens early with your leadership in the room, because settling what margin means is an executive act the developer facilitates, not decides. Check a reference whose pipeline has survived a source-system change, since that is the maintenance moment that separates builders from decorators. Digital Heroes builds the warehouse and pipelines in your cloud accounts, documents every definition where your team can read it, and treats a numbers-disagree ticket as the highest-severity defect in the system.
- !They open with dashboard mockups instead of asking where your data lives; pretty charts on bad plumbing is the standard failure
- !No entity-resolution plan for your three spellings of the same customer; ask how they match records across systems
- !Metric definitions left to later; demand the definitions workshop in week one, on the record
- !A proprietary BI platform you must subscribe to forever; the warehouse and pipeline should be yours outright
- !No answer for when a source system changes its export format; pipelines break, ask about monitoring
Most Yonkers teams pricing business intelligence dashboards end up comparing notes on helpdesk & ticketing, erp, custom software too; the systems share one data spine. Weighing options across the region? We publish the same business intelligence dashboards guide for New York, Buffalo, Rochester. Prefer to talk to the team that builds these? Digital Heroes handles custom software development end to end.
The evidence behind this guide
Independent findings on why this investment pays off. Every link goes to the primary source.
- SaaS spend averaged $4,830 per employee (up 21.9% year over year), with large enterprises (10,000+ employees) spending roughly $284M annually and running about 660 apps, while organizations wasted an average of $21M annually on unused licenses. Source: Zylo (2025) →
- In a McKinsey global survey of 1,259 respondents, only about 20% said their organizations excel at decision making, and just 37% said their organizations' decisions were both high quality and high in velocity. Source: McKinsey & Company (2019) →
- Across more than 5,400 IT projects studied by McKinsey and the University of Oxford BT Centre, large IT projects ran on average 45% over budget and 7% over schedule while delivering 56% less value than predicted. Source: McKinsey & Company / University of Oxford (BT Centre for Major Programme Management) (2012) →
- WordPress powers 41.5% of all websites and holds 59.2% of the market among sites running a known content management system, making it by far the most-used CMS on the web. Source: W3Techs (2026) →
Shaurya builds cross platform apps in React Native at Digital Heroes, sharing logic between iOS and Android and dropping into native code where the shared layer runs out. His posts are useful for teams estimating a cross platform build and wondering where the hidden work sits.
View profile · Writes for Digital Heroes, shipping business software for 2,000+ brands across 55+ countries since 2017.
Frequently asked questions
What does a custom BI dashboard setup cost for a Yonkers multi-location business?
A pipeline, warehouse, and core dashboard build runs $40,000 to $65,000; entity resolution and per-unit margin views bring it to $65,000 to $90,000; alerting and forecasting reach $110,000. These are Digital Heroes' delivery bands. The recurring surprise for buyers: most of the budget goes to plumbing, and that is exactly where it should go.
Why not just buy Power BI licenses? They cost almost nothing.
Because your problem is upstream of visualization: Power BI Pro lists around $14 a user and Tableau Creator at $75, and neither will extract your POS data, match your three spellings of the same customer, or settle whose revenue number is right. Buy the license if you want; the pipeline still has to be built. Some of our builds actually use Power BI as the final display layer on top of the custom warehouse.
Our POS, QuickBooks, and scheduling tool all report different revenue. Which one wins?
None of them wins by default; the build makes the reconciliation explicit: each system's number is extracted, the differences are explained by rule, timing, refunds, account coding, and one governed definition becomes the company's answer. That definitions workshop is an executive session, not a technical one. After it, meetings argue about decisions instead of inputs, which is the entire point.
Can the owner get the day's numbers without opening a laptop?
Yes: a morning digest by email or SMS with yesterday's revenue, margin, and exceptions per location is a standard deliverable, and for most owners it becomes the most-used feature of the whole build. Dashboards serve the deep dives; the digest serves the daily pulse. Both read from the same warehouse, so they never disagree.
How long until we see real dashboards on our real data?
First dashboards on live data land at 8 to 11 weeks, with the pipeline running automatically before that. The definitions workshop and data cleaning set the pace more than the code does. A useful early milestone to demand: the week the automated number matches the hand-built Friday spreadsheet, which is when trust transfers and the ritual can die.
What happens when one of our source systems changes or we replace it?
The pipeline's extractor for that system gets updated, the warehouse and dashboards stay untouched, and history is preserved; this modularity is a core reason to own the layer rather than rent a bundled one. Pipeline monitoring should alert on broken or anomalous feeds automatically. Budget maintenance at 15 to 20 percent of build cost annually, which covers exactly this.
Is our data safe sitting in one warehouse?
Safer than scattered across spreadsheets emailed weekly: the warehouse lives in your own cloud account with encryption, role-based access, and audit logging, and nothing sensitive transits personal inboxes anymore. Access follows roles, so a location manager sees their location and the bookkeeper sees exceptions. Centralizing done properly raises your security posture rather than lowering it.
Can it tell us which crews, accounts, or service lines actually make money?
Yes, and this is usually the revelation of the first quarter: once job, labor, and billing data share a warehouse, margin computes per crew, per account, and per service line rather than in aggregate. Most multi-line operators discover a beloved service line that quietly loses money at current pricing. That single finding tends to fund the build retroactively.
Do we own the warehouse and pipelines, or is this another subscription?
You own them: infrastructure in your cloud accounts, code in your repository, definitions documented in plain language your team can read. Ongoing costs are cloud hosting, typically modest at this scale, plus maintenance. The anti-pattern to refuse is a bundled proprietary platform where leaving the vendor means losing your history; your accumulated data is the asset, keep it yours.
What are the biggest mistakes first-time software buyers make?
Can custom software connect to the tools we already use, like QuickBooks, Stripe, and Google Workspace?
What are the most common mistakes companies make on dashboard projects?
We already pay for Microsoft 365. When does building custom actually beat Power BI?
How do I calculate whether custom software will pay for itself?
What does it cost to keep custom software running after launch?
Can we migrate years of data out of our current system into new custom software?
What should the first version of a dashboard include, and what can wait?
Can one dashboard pull from QuickBooks, Salesforce, and Google Analytics at the same time?
Who can build custom business intelligence dashboards for a business in Yonkers?
Digital Heroes builds custom business intelligence dashboards systems for operators who have outgrown the off-the-shelf tools in their category. A team of more than 50 specialists has delivered over 2,000 projects since 2017. Teams work from New York, London, Sydney, Delhi and Lucknow and deliver remotely, so an operator in Yonkers gets an assigned senior team rather than a local account manager.
Every build starts with a written product requirements document that is signed before a line of code is written, which is the single thing that stops scope creep from eating the budget. Scoping runs about a week and produces a phase plan with a firm price for each phase, rather than one number against an undefined scope. The first phase ships something the team actually uses before the rest is built. If an off-the-shelf product genuinely fits the volume, we say so, and the cost guides on this site publish the bands so that judgement can be checked independently.
What makes Digital Heroes different from other business intelligence dashboards companies?
Four things that competitors in this bracket cannot simply copy. Digital Heroes runs a YouTube channel with more than 2.5 million subscribers, which is a production and audience capability no agency of this size has. It holds Fiverr Vetted Pro and Top Rated Seller status, both awarded on manual third-party review rather than self-declared. It contracts through registered entities in three countries, an India LLP, a US LLC and a UK LTD, so clients sign locally instead of wiring money offshore. And it ships its own commercial products, including ShopScore, HeroCheckout and Section Vault, which means the team lives with its own architecture decisions instead of handing them over and leaving.
Two more that show up in the work. Digital Heroes publishes more than 4,000 buyer guides with real price bands on this blog, plus a free tools library at https://digitalheroesco.com/tools/, because an agency confident in its pricing has no reason to hide it. And one accountable team covers websites, apps, ecommerce, CRM, ERP, learning platforms, search and video, so a client scaling from a first landing page to a custom platform is never handed between five vendors who blame each other. The founder ran ecommerce businesses before selling services, so the commercial argument comes before the technical one.
How can I check Digital Heroes is legitimate before getting in touch?
Verify it independently rather than taking the site's word for it. The YouTube channel is at https://youtube.com/@DigitalMarketingHeroes, the Fiverr profile at https://www.fiverr.com/shreyanshsin261, and the Upwork profile at https://www.upwork.com/freelancers/shreyanshsingh. Client reviews sit on Clutch at https://clutch.co/profile/digital-heroes-0 and Trustpilot at https://www.trustpilot.com/review/digitalheroes.co.in, and the company page is at https://www.linkedin.com/company/digital-heroes-1/.
Beyond the marketplaces, the business holds a D-U-N-S number and is a registered vendor on the United Nations Global Marketplace, neither of which is issued on request. Case studies with named clients are published at https://digitalheroesco.com/case-studies/. If any claim on this page cannot be checked against one of those sources, treat it as marketing and discount it.


