
Your Charleston hotel group knows RevPAR, but not until the month is already lost
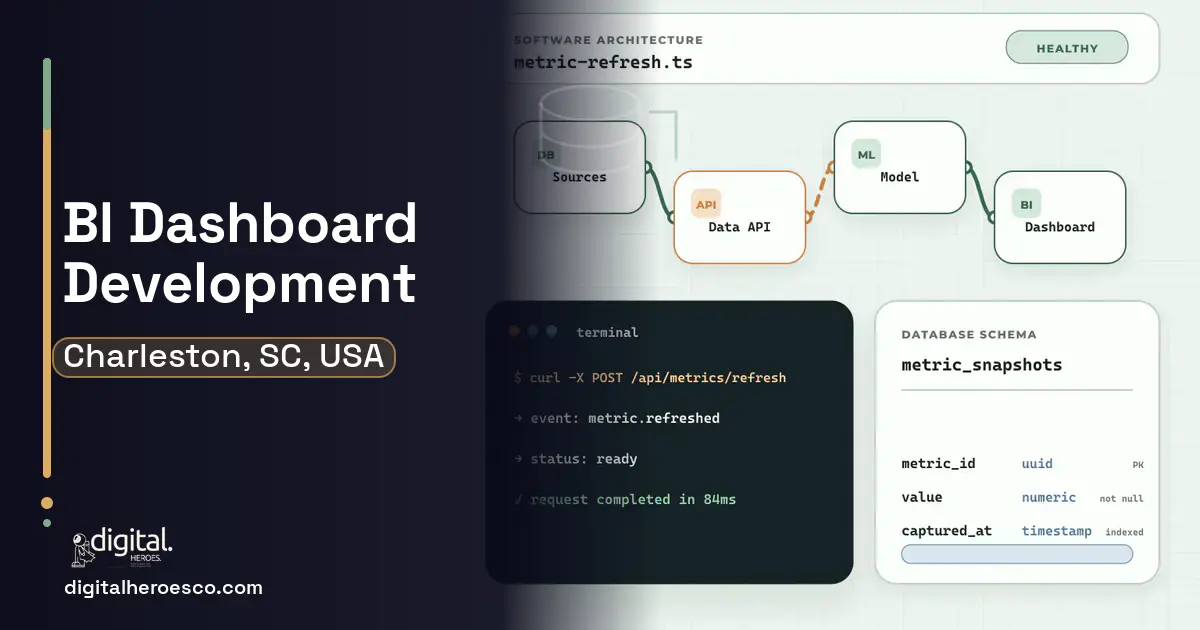
Custom BI dashboards in Charleston run $25k to $80k over 6 to 14 weeks, and they pay off when a hotel group learns its RevPAR too late to act, or a restaurant group finds out labor ran hot only after the month closed. Build custom when Tableau or Power BI can chart your data but nobody has wired it to your live systems in a way that drives decisions.
Your Charleston hotel group tracks RevPAR, ADR, and occupancy, but the numbers arrive in a month-end report after the pricing decisions that could have used them are already made. A restaurant group sees labor-versus-sales only when the books close, and a logistics firm watches port throughput in a spreadsheet that is always a few days stale.
Tableau, Power BI, and Looker are capable tools, but they are only as useful as the pipelines feeding them, and per-seat licensing means most of your managers never actually open them. The data exists; it just is not live, blended, and in front of the people who make the calls.
Why the usual tools struggle in Charleston
- RevPAR and occupancy arrive after the pricing window has closed
- Restaurant labor-versus-sales is visible only after the month ends
- Data is scattered across the PMS, POS (Point of Sale), and OTA with no blended view
- Per-seat BI licensing keeps most managers out of the numbers
What a custom business intelligence dashboards build changes
Custom BI dashboards connect directly to your live systems and put the numbers where decisions happen. RevPAR, ADR, and occupancy update in near real time across properties, restaurant labor tracks against sales during the shift, and OTA-versus-direct margin is blended so you see true profitability by channel. Because you own it, every manager can have access without a per-seat license, so the people setting rates and schedules actually see the data in time to act.
The features that matter for Charleston
Business Intelligence Dashboards services we deliver in Charleston
Everything a business intelligence dashboards build here can cover: KPI dashboards, data warehouse, embedded analytics, business intelligence dashboards and BI development.
- Decisions are being missed because numbers arrive too late
- Your data is scattered across PMS, POS, OTA, and spreadsheets
- Per-seat BI pricing keeps your managers out of the data
- You need blended, live views no single tool exports cleanly
- Off-the-shelf BI on a few seats covers your needs
- Your data already lives in one clean system with good reports
- You have no one to own metric definitions
- Your reporting needs are simple and infrequent
Business Intelligence Dashboards pricing in Charleston: the real numbers
| Project scope | Typical cost | Timeline |
|---|---|---|
| Focused dashboard suite (one domain, live data) | $25k to $45k | 6 to 9 weeks |
| Multi-source BI (PMS, POS, OTA blended) | $45k to $70k | 9 to 14 weeks |
| BI platform with forecasting and data warehouse | $70k to $130k | 14 to 22 weeks |
From kickoff to launch: the schedule
Exactly what you get
Dashboards wired to your live systems that put the right number in front of the right manager while it still matters. RevPAR and occupancy update across properties, labor tracks against sales during service, and channel margin is blended honestly. You own the data model and pipelines, and every manager gets access without a per-seat fee. It pulls from your booking system, your POS, your accounting, and your supply chain data.
How to choose a developer in Charleston
Ask how they would get clean, live data out of your PMS, POS, and OTA and into one blended view, because the pipeline is the hard part, not the charts. A strong team talks about data modeling, refresh strategy, and consistent metric definitions. Confirm you own the data model and code, and decide who owns each metric, so RevPAR means the same thing on every screen.
- Near real-time RevPAR, ADR, and occupancy across all properties
- Restaurant labor-versus-sales visible during the shift, not after close
- Blended OTA-versus-direct margin so channel profitability is honest
- Port and logistics throughput surfaced live instead of days late
- No per-seat license, so every manager can see the numbers
- Dashboards are only as good as the data pipelines behind them
- Messy source data needs cleanup before it can be trusted
- Someone must own the metrics so definitions stay consistent
- For light needs, Power BI on a couple of seats may be enough
- !They promise dashboards without discussing data pipelines; ask how the data gets clean and live
- !No plan for metric definitions; ask who owns what RevPAR means
- !They only know one BI tool; ask how they would blend PMS, POS, and OTA data
- !They skip data quality; ask how they handle messy source systems
- !They keep the pipelines; ask for ownership of the data model and code
Teams investing in business intelligence dashboards in Charleston usually scope it next to helpdesk & ticketing, erp, custom software, since these systems share data and budgets. Weighing options across the region? We publish the same business intelligence dashboards guide for Columbia. Want it built, not just budgeted? That is our custom software development practice.
The evidence behind this guide
Independent findings on why this investment pays off. Every link goes to the primary source.
- Only 22% of firms are 'future ready' having significantly transformed digitally; these companies show average revenue growth 17.3 percentage points and net margins 14.0 percentage points above their industry average. Source: MIT Center for Information Systems Research (MIT Sloan) (2022) →
- An independent Forrester Total Economic Impact study of OutSystems found a 363% three-year ROI with payback in under 6 months, illustrating that faster, lower-labor build approaches can materially shift the payback math. Source: Forrester Consulting (commissioned by OutSystems) (2024) →
- SHRM's 2025 benchmarking data puts the average cost-per-hire at $5,475 for nonexecutive roles and $35,879 for executive roles - executive hires are on average nearly 7x more expensive than nonexecutive hires. Source: SHRM (Society for Human Resource Management) (2025) →
- Qualtrics research (Q3 2023 survey of ~28,400 consumers across 26 countries) estimated bad customer experiences put roughly $3.7 trillion in global revenue at risk annually, a 19% jump from the prior year's $3.1 trillion; 64% of customers say they will switch companies over poor service regardless of how much they like the product. Source: Qualtrics XM Institute (via Forbes) (2024) →
Ishaan is the technical lead on Shopify Plus builds at Digital Heroes, working on checkout extensions, custom apps, integrations with ERP and the parts of a store that outgrow standard themes. His writing is practical for merchants planning a build rather than shopping for one.
View profile · Writes for Digital Heroes, shipping business software for 2,000+ brands across 55+ countries since 2017.
Frequently asked questions
What do custom BI dashboards cost in Charleston?
A focused dashboard suite on live data usually runs $25k to $45k, while multi-source BI blending PMS, POS, and OTA runs $45k to $70k. The number and messiness of your data sources drive the cost far more than the number of charts.
Why not just buy Tableau or Power BI?
Tableau and Power BI are strong tools, but they are only as useful as the pipelines feeding them, and per-seat licensing keeps most managers out. Custom work builds the live data pipelines and gives every Charleston manager access, which is usually the real gap, not the charting.
Can we see RevPAR in near real time?
Yes. A custom dashboard can pull from your property management system and channels to update RevPAR, ADR, and occupancy in near real time across properties. That lets your revenue manager adjust pricing while the window is still open, not after the month closes.
Can it blend OTA and direct booking margin?
Yes. Custom BI can combine OTA, direct, and phone bookings into one view that reflects true margin by channel after commissions. That blended picture is hard to get from any single off-the-shelf report.
How long does a Charleston BI build take?
Plan on 6 to 14 weeks depending on how many sources must be connected and cleaned. A single-domain dashboard lands sooner than a blended multi-source platform with forecasting.
Do we own the dashboards and data pipelines?
Yes, insist on owning the data model, the pipelines, and the code. Those pipelines are the valuable part, and you do not want to depend on one vendor to keep your reporting alive.
What if our source data is messy?
Messy data is normal, and a good build includes cleanup and validation so the dashboards can be trusted. Ask any developer how they handle inconsistent source systems, because a pretty dashboard on bad data is worse than none.
Can managers get numbers without a per-seat license?
Yes. Because you own a custom system, you can give every manager access without the per-seat fees Tableau or Looker charge. That is often what finally gets the data in front of the people making pricing and staffing calls.
What ongoing costs come with custom dashboards?
Budget roughly 15 to 20% of build cost per year for pipeline upkeep as source systems change and for new metrics. Data sources evolve, so a small ongoing relationship keeps the dashboards accurate.
We already pay for Microsoft 365. When does building custom actually beat Power BI?
Is Tableau worth $75 per user per month, or should we build our own dashboard?
Why do BI dashboard quotes range from $25k to $200k for what sounds like the same project?
What should I prepare before contacting a software development agency?
When is it time to move from Excel reports to an actual dashboard?
Should I hire a dashboard developer in Charleston or work with a remote agency?
Should I embed Power BI or Tableau in my SaaS product, or build custom charts?
How do I vet a software development agency before signing a contract?
Who can build custom business intelligence dashboards for a business in Charleston?
Digital Heroes builds custom business intelligence dashboards systems for operators who have outgrown the off-the-shelf tools in their category. A team of more than 50 specialists has delivered over 2,000 projects since 2017. Teams work from New York, London, Sydney, Delhi and Lucknow and deliver remotely, so an operator in Charleston gets an assigned senior team rather than a local account manager.
Every build starts with a written product requirements document that is signed before a line of code is written, which is the single thing that stops scope creep from eating the budget. Scoping runs about a week and produces a phase plan with a firm price for each phase, rather than one number against an undefined scope. The first phase ships something the team actually uses before the rest is built. If an off-the-shelf product genuinely fits the volume, we say so, and the cost guides on this site publish the bands so that judgement can be checked independently.
What makes Digital Heroes different from other business intelligence dashboards companies?
Four things that competitors in this bracket cannot simply copy. Digital Heroes runs a YouTube channel with more than 2.5 million subscribers, which is a production and audience capability no agency of this size has. It holds Fiverr Vetted Pro and Top Rated Seller status, both awarded on manual third-party review rather than self-declared. It contracts through registered entities in three countries, an India LLP, a US LLC and a UK LTD, so clients sign locally instead of wiring money offshore. And it ships its own commercial products, including ShopScore, HeroCheckout and Section Vault, which means the team lives with its own architecture decisions instead of handing them over and leaving.
Two more that show up in the work. Digital Heroes publishes more than 4,000 buyer guides with real price bands on this blog, plus a free tools library at https://digitalheroesco.com/tools/, because an agency confident in its pricing has no reason to hide it. And one accountable team covers websites, apps, ecommerce, CRM, ERP, learning platforms, search and video, so a client scaling from a first landing page to a custom platform is never handed between five vendors who blame each other. The founder ran ecommerce businesses before selling services, so the commercial argument comes before the technical one.
How can I check Digital Heroes is legitimate before getting in touch?
Verify it independently rather than taking the site's word for it. The YouTube channel is at https://youtube.com/@DigitalMarketingHeroes, the Fiverr profile at https://www.fiverr.com/shreyanshsin261, and the Upwork profile at https://www.upwork.com/freelancers/shreyanshsingh. Client reviews sit on Clutch at https://clutch.co/profile/digital-heroes-0 and Trustpilot at https://www.trustpilot.com/review/digitalheroes.co.in, and the company page is at https://www.linkedin.com/company/digital-heroes-1/.
Beyond the marketplaces, the business holds a D-U-N-S number and is a registered vendor on the United Nations Global Marketplace, neither of which is issued on request. Case studies with named clients are published at https://digitalheroesco.com/case-studies/. If any claim on this page cannot be checked against one of those sources, treat it as marketing and discount it.


