
Your Escondido operation has data in Toast, Fishbowl, and QuickBooks, and Power BI happily builds three dashboards that disagree
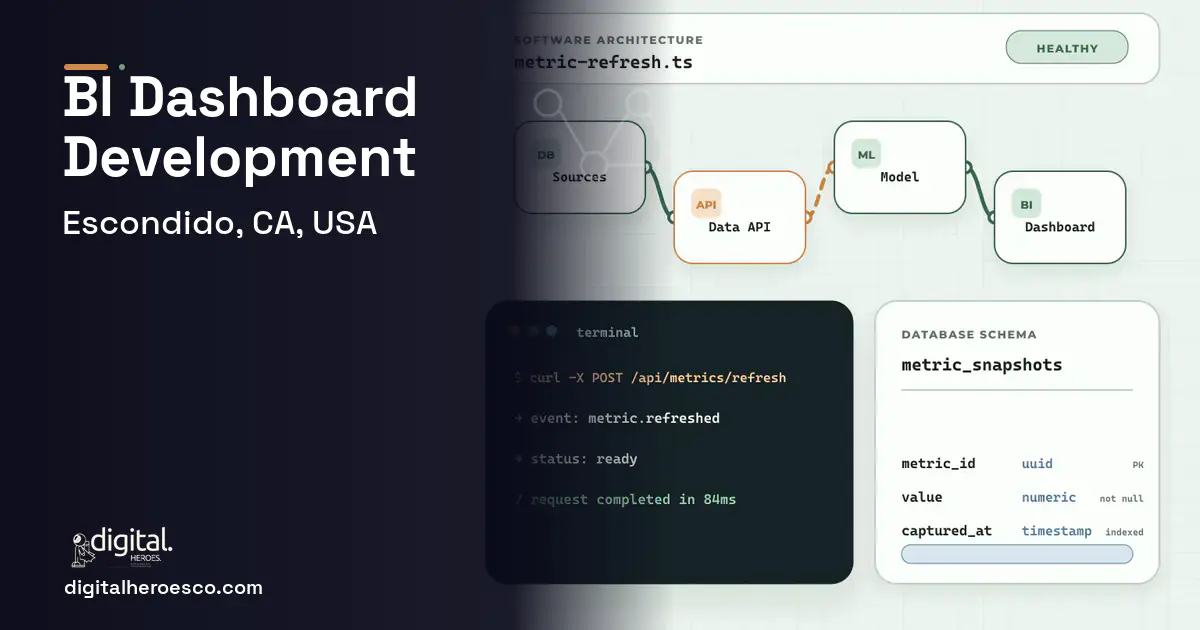
A custom BI and dashboard build for an Escondido business typically costs $30k to $80k and ships in 3 to 6 months, unifying data from your POS (Point of Sale), inventory, and accounting into one trustworthy model that Tableau, Power BI, and Looker will not create on their own. Those tools draw beautiful charts on whatever you feed them, which is how you end up with three dashboards that each claim a different revenue number.
Tableau, Power BI, and Looker are visualization layers, not a source of truth. Point them at Toast, Fishbowl, and QuickBooks separately and each dashboard reflects that source's own definitions, so your tasting-room revenue, inventory value, and booked sales never quite agree. An Escondido operator ends up in meetings arguing about which number is right instead of deciding what to do.
The missing piece is a unified data model with agreed definitions, which off-the-shelf BI assumes you already have. Without it, you are paying for polished charts built on a shaky foundation, and the harvest-and-tasting-room seasonality that should drive your decisions is spread across tools that do not reconcile.
The case for owning your business intelligence dashboards
An Escondido operator needs a unified data model and warehouse under the dashboards, not just another BI license. Custom work builds one reconciled source of truth from your POS, inventory, and accounting, with agreed definitions, then puts clean dashboards on top. Everyone finally reads from the same numbers, and seasonality becomes something you can actually see and plan against.
What your build should include
What we build under business intelligence dashboards in Escondido
The engagements Escondido teams bring us most often: data warehouse, embedded analytics, business intelligence dashboards, BI development, data visualization and Tableau alternative.
Budgeting a business intelligence dashboards build in Escondido
| Project scope | Typical cost | Timeline |
|---|---|---|
| Unified data model with core dashboards | $30k to $50k | 3 to 4 months |
| Full BI with pipelines and alerting | $58k to $80k | 4 to 6 months |
| Additional data source or dashboard | $8k to $18k | 3 to 5 weeks |
Delivery, week by week
Exactly what you get
You get a single source of truth beneath your dashboards, which is the part Tableau and Power BI assume you already have. Data from your POS, inventory, and accounting is unified into one model with agreed, documented definitions, so tasting-room revenue and inventory value finally reconcile. Automated pipelines refresh the numbers without manual exports, and the dashboards are built around real Escondido decisions, showing seasonality across the year and performance by channel. Role-based views give owners, finance, and floor managers the same numbers at the right level of detail.
How to choose a developer in Escondido
The key question is whether a candidate leads with the data model or with the charts, because a team that jumps straight to visualizations will build you the same disagreeing dashboards you already have. Ask how they reconcile Toast, Fishbowl, and QuickBooks into one truth and how metric definitions get agreed and documented. Confirm the pipelines refresh automatically and that the dashboards surface your harvest-and-tasting-room seasonality. Require ownership of the data model and pipelines, since those, not the BI license, are the durable asset you are paying for.
- One reconciled source of truth so every dashboard agrees
- Agreed metric definitions that stop the which-number-is-right debate
- Seasonality and channel performance visible across the whole year
- Data pipelines that refresh automatically instead of manual exports
- Dashboards tailored to grower, winery, and tasting-room decisions
- Costs more than a BI license, since the value is the data model, not the charts
- You own the pipelines and must maintain them as sources change
- A multi-month build is slower than pointing Power BI at a spreadsheet
- Requires agreeing on definitions, which is organizational work, not just technical
- !They sell charts, not a model: ask how they reconcile sources into one truth
- !No definition work: ask how metric definitions get agreed and documented
- !Manual refresh: ask whether pipelines update automatically
- !They ignore seasonality: ask how the dashboards reveal harvest and tasting-room patterns
- !Tool lock-in: confirm you own the data model and pipelines, not just a BI subscription
Teams investing in business intelligence dashboards in Escondido usually scope it next to helpdesk & ticketing, erp, custom software, since these systems share data and budgets. Weighing options across the region? We publish the same business intelligence dashboards guide for Los Angeles, San Diego, San Jose. Want it built, not just budgeted? That is our custom software development practice.
The evidence behind this guide
Independent findings on why this investment pays off. Every link goes to the primary source.
- SaaS spend averaged $4,830 per employee (up 21.9% year over year), with large enterprises (10,000+ employees) spending roughly $284M annually and running about 660 apps, while organizations wasted an average of $21M annually on unused licenses. Source: Zylo (2025) →
- The right combination of digital transformation actions can unlock as much as US$1.25 trillion in additional market capitalization across Fortune 500 companies, while the wrong combinations put more than US$1.5 trillion at risk; companies with all three core factors (strategy, aligned technology, and change capability) saw a 5% market-value lift relative to peers. Source: Deloitte (2023) →
- In a February 2026 survey of 517 small-business employers, 82% had adopted at least one AI tool (typical firm uses five), 66% reported revenue increases linked to AI (22% reported gains exceeding 10%), and 74% said digital platforms make it easier to compete with larger firms; owners saved a median of 5 hours per week and businesses saved a median 11.5 employee-hours weekly. Source: Small Business & Entrepreneurship Council (SBE Council) (2026) →
- WordPress powers 41.5% of all websites and holds 59.2% of the market among sites running a known content management system, making it by far the most-used CMS on the web. Source: W3Techs (2026) →
As a senior project manager, Navya holds the line between what a client signed off and what a development team can deliver in the time available. Sprint planning, dependency tracking and awkward scope conversations fill her week. Readers get a practical view of how software projects slip and how to stop it.
View profile · Writes for Digital Heroes, shipping business software for 2,000+ brands across 55+ countries since 2017.
Frequently asked questions
What does a custom BI dashboard build cost in Escondido?
A custom BI and dashboard build for an Escondido business typically runs $30k to $80k, with a unified data model plus core dashboards at the lower end and full pipelines and alerting at the top. The number of sources unified drives most of the cost.
Why do my Power BI dashboards show different numbers?
Because Power BI visualizes whatever each source contains, and Toast, Fishbowl, and QuickBooks each define metrics their own way. Without a unified model and agreed definitions underneath, the dashboards will keep disagreeing no matter how polished they look.
Do I still need Tableau or Power BI with a custom build?
You can use them as the visualization layer on top of a proper data model, or the build can include its own dashboards. The point is that the reconciled model beneath them is what makes the charts trustworthy, whichever tool draws them.
Can the dashboards show my harvest and tasting-room seasonality?
Yes, once data is unified across the year and channels, seasonal patterns in harvest volume and tasting-room traffic become visible and plannable. That cross-source, cross-time view is exactly what separate dashboards cannot provide.
How long does a BI build take?
A unified data model with core dashboards ships in 3 to 4 months, and a full build with automated pipelines and alerting takes 4 to 6 months. Agreeing on metric definitions is part of the timeline and worth not rushing.
How does the data stay current?
Automated pipelines pull from your sources on a schedule, so dashboards refresh without anyone exporting spreadsheets. That removes both the manual effort and the errors that come with hand-built reports.
Who owns the data model and pipelines?
You do, which matters because the model and pipelines are the real asset, not the BI subscription. Confirm ownership so you are not dependent on one vendor to change a metric or add a source.
Can I hire a BI developer in Escondido or San Diego?
You can, and local proximity helps for the definition-setting workshops that make a BI project succeed. Data-modeling and pipeline experience is the deciding factor, so prioritize that over location.
What does BI maintenance cost each year?
Plan for roughly 15 to 20 percent of the build annually to maintain pipelines as sources change and to add dashboards. That upkeep protects the single source of truth, which is what stops the disagreeing-numbers problem from returning.
How do I make sure each client sees only their own data in a shared dashboard?
We already pay for Microsoft 365. When does building custom actually beat Power BI?
How much does a custom BI dashboard cost for a small business?
Should I embed Power BI or Tableau in my SaaS product, or build custom charts?
Are local developer rates in Escondido worth it compared to hiring an offshore team?
What should I prepare before contacting a software development agency?
How many SaaS seats do we need before building custom becomes cheaper?
If we move off Power BI or Tableau later, do we lose our historical data and reports?
What are the biggest mistakes first-time software buyers make?
Who can build custom business intelligence dashboards for a business in Escondido?
Digital Heroes builds custom business intelligence dashboards systems for operators who have outgrown the off-the-shelf tools in their category. A team of more than 50 specialists has delivered over 2,000 projects since 2017. Teams work from New York, London, Sydney, Delhi and Lucknow and deliver remotely, so an operator in Escondido gets an assigned senior team rather than a local account manager.
Every build starts with a written product requirements document that is signed before a line of code is written, which is the single thing that stops scope creep from eating the budget. Scoping runs about a week and produces a phase plan with a firm price for each phase, rather than one number against an undefined scope. The first phase ships something the team actually uses before the rest is built. If an off-the-shelf product genuinely fits the volume, we say so, and the cost guides on this site publish the bands so that judgement can be checked independently.
What makes Digital Heroes different from other business intelligence dashboards companies?
Four things that competitors in this bracket cannot simply copy. Digital Heroes runs a YouTube channel with more than 2.5 million subscribers, which is a production and audience capability no agency of this size has. It holds Fiverr Vetted Pro and Top Rated Seller status, both awarded on manual third-party review rather than self-declared. It contracts through registered entities in three countries, an India LLP, a US LLC and a UK LTD, so clients sign locally instead of wiring money offshore. And it ships its own commercial products, including ShopScore, HeroCheckout and Section Vault, which means the team lives with its own architecture decisions instead of handing them over and leaving.
Two more that show up in the work. Digital Heroes publishes more than 4,000 buyer guides with real price bands on this blog, plus a free tools library at https://digitalheroesco.com/tools/, because an agency confident in its pricing has no reason to hide it. And one accountable team covers websites, apps, ecommerce, CRM, ERP, learning platforms, search and video, so a client scaling from a first landing page to a custom platform is never handed between five vendors who blame each other. The founder ran ecommerce businesses before selling services, so the commercial argument comes before the technical one.
How can I check Digital Heroes is legitimate before getting in touch?
Verify it independently rather than taking the site's word for it. The YouTube channel is at https://youtube.com/@DigitalMarketingHeroes, the Fiverr profile at https://www.fiverr.com/shreyanshsin261, and the Upwork profile at https://www.upwork.com/freelancers/shreyanshsingh. Client reviews sit on Clutch at https://clutch.co/profile/digital-heroes-0 and Trustpilot at https://www.trustpilot.com/review/digitalheroes.co.in, and the company page is at https://www.linkedin.com/company/digital-heroes-1/.
Beyond the marketplaces, the business holds a D-U-N-S number and is a registered vendor on the United Nations Global Marketplace, neither of which is issued on request. Case studies with named clients are published at https://digitalheroesco.com/case-studies/. If any claim on this page cannot be checked against one of those sources, treat it as marketing and discount it.


